Proteomics Uncovers Potential Markers, Subtypes of Alzheimer’s
Quick Links
In the last three decades, scientists have made strides in using biomarkers to diagnose Alzheimer’s disease and track its progression. Along with cerebrospinal fluid Aβ, tau, and phospho-tau, a handful of new markers, such as neurofilament light, neurogranin, and YKL40, seem poised to add diagnostic value. Newcomers such as NPTX2 and SV2A may also prove helpful (see Part 11 of this series). But what of the thousands of other proteins in the CSF and in the brain? This year’s AAIC, held July 14-18 in Los Angeles, showcased the power of proteomics, a set of methods that after years of generating diffuse, head-scratching results, is now coming into its own.
- Proteome analysis may reveal synaptic changes, subtypes of AD.
- They may explain the basis of polygenic risk.
- NeuroTool Kit puts evaluation, validation of candidates on common footing.
Researchers showed how proteomics methods can identify functionally related groups of proteins in the CSF that change with disease state, and might reveal insight into the underlying etiology or identify new markers of pathology. Others used the approach to identify clusters of proteins that appear dysregulated in specific groups of patients, suggesting AD subtypes might exist. Still others used proteomics to tease out synaptic changes in AD.
Becky Carlyle, who works at the lab of Steven Arnold at Massachusetts General Hospital, Charleston, took the latter approach. Carlyle investigates the synaptic underpinnings of resilience in AD. In other words, she teases out why some people stay cognitively intact despite having extensive plaque and tangle pathology.
Carlyle compared proteomes from four different groups of patients within the ROSMAP cohort at Rush University. First, she purified synaptosomes from brain tissue to avoid confounds caused by changes in cell volume, which can skew whole-tissue proteomics. Then she analyzed the synaptosome fractions using tandem mass-tag spectroscopy, a more sensitive and accurate version of mass spectrometry. Among samples from 100 people, she found 9,558 different proteins in the synaptosome fractions. Nearly half of those were present in all of the samples, so she focused on those, correlating them with pathology and cognitive status.
Carlyle found no differences in the composition of known pre- and postsynaptic markers in synaptosomes from amyloid-positive people with dementia and from those with dementia who were resilient. For example, SNAP25 and synapsin 1 levels in synaptosomes from AD patients were similar to those in synaptosomes from normal controls and from people Carlyle defined as cognitively frail—meaning they had no obvious brain pathology but were cognitively impaired. However, using pathology and cognition as continuous variables, Carlyle teased out some correlations.
Seventeen synaptic proteins associated with pathology and 24 with global cognitive score. One, neurosecretory protein VGF, tracked with both pathology and cognition. Proteins strongly linked with pathology only included VEGF receptor 1 and SPARC-related modular calcium-binding protein 1. SMOC1 is a member of the SPARC family of cell-surface proteins, of which SPARCL1 was recently reported to bestow synaptogenic properties on blood from young animals (Jun 2019 news). Of the proteins that associated only with cognition, NPTX2 correlated most strongly. Chromogranin A, a synaptic protein that previously had been linked to AD, did as well (Mar 2019 news; Mattsson et al., 2013).
Because ELISA or mass-spec assays are established for VGF, VEGFR1, NPTX2, chromogranin A, and SMOC1, these should be tested further as biological markers, said Carlyle. In fact, NPTX2, SMOC1, and VGF were among the hits in a proteomic analysis led by Nick Seyfried at Emory University in Atlanta. “It was very encouraging to see the similarity across our datasets,” he told Alzforum. “This bodes well for the rigor and reproducibility of these proteomic measurements.”
Seyfried took an unbiased, integrative, network-based approach to search for proteomic changes in the CSF and brains of dementia patients that overlap and might help to stage AD progression. He had previously identified more than 40 modules of related proteins in the brain using weighted co-expression network analysis of deep proteomic datasets, i.e., those containing more than 9,000 proteins (Jul 2017 conference news). For CSF, he compared protein levels among 20 AD patients and 20 controls using multiplex tandem mass-tag spectroscopy, and related those differences to the brain co-expression modules.
Seyfried identified about 43,000 peptides from 3,927 proteins across all 40 samples. Of these proteins, 228 were more abundant in AD CSF than controls, while 148 went the opposite way. The increased included TREM2, tau, and neuregulin, while NPTX2 and VGF were among the decreased. These differentially expressed proteins overlapped with 10 network modules previously identified in the brain. These modules covered five basic functional categories: synapses; humoral immunity; myelin; glia and injury response; metabolism. “We were particularly interested in CSF proteins that mapped to the glia modules in the brain because these contained tau, microglial proteins, and other proteins related to neuroinflammation, including SMOC1,” said Seyfried.
To validate specific proteins within these modules, Seyfried and colleagues relied on “parallel reaction monitoring.” This is a more quantitative type of mass spec where internal standards are spiked into the sample before analysis. From the glial, myelination, and synaptic modules, SMOC1, osteopontin, and UCHL1, respectively, were more abundant in AD versus control CSF. To see how SMOC1 changed during the course of disease, Seyfried analyzed 96 individual CSF samples from the Emory Goizueta Alzheimer’s Disease Research Center. Of these, 32 with asymptomatic AD had more SMOC1 in CSF, on average, than did 32 controls, and 32 AD patients had even more than the asymptomatic cases. “We need more groups looking into new targets, like SMOC1, that are being replicated independently. They could have high value as biomarkers or therapeutic value,” said Seyfried.
Other groups use proteomic analysis to distinguish subtypes of late-onset AD. Because the disease is so heterogeneous in presentation and progression, scientists believe that different triggers may cause or modulate its pathology. Betty Tijms and colleagues at Amsterdam University Medical Center reported three subtypes of AD based on CSF proteomics.
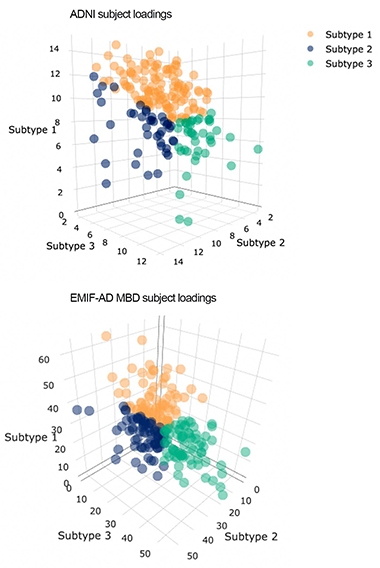
Alzheimer's Types? People (dots) fall into one of three subtypes (blue, green, and orange) that best fit correlations among proteins and individuals in the ADNI and EMIF data sets. Higher axes values indicate better matches to those subtypes. [Courtesy of Betty Tijms, VU Amsterdam.]
The researchers analyzed proteomic data from CSF of people in ADNI and, in collaboration with Johan Gobom at the University of Gothenburg, Sweden, from CSF in the EMIF-AD Multimodal Biomarker Discovery (MBD) cohort. From mass spectroscopy and ELISA of 127 controls and 425 AD patients, Tijms identified 705 proteins that were either up- or downregulated in AD, and simultaneously clustered them by protein and by patient to identify proteomic subtypes.
Most people in ADNI and EMIF-AD MBD fell into one of three subtypes (see image at right). In subtype 1, synaptic proteins were enriched in the CSF, suggesting a hyperplasticity, said Tijms. Subtype 2 was marked by elevated levels of immune proteins in CSF. In contrast, subtype 3 CSF had less synaptic proteins but increased levels of proteins involved in blood-brain barrier integrity. Subtype 3 also had the least CSF tau and p-tau, while subtype 1 had the highest.
What does this mean? Scientists at AAIC wondered if these groups represent true etiological types, or people who deteriorate at different rates. Either way, they agreed that stratifying subjects in this manner might tease out differences in responses to treatment. Tijms hopes that subtyping might allow for a more personalized approach to medicine.
There were few demographic differences among these three subtypes. Still, ADNI participants with subtype 2 tended to be older and more were male than those with subtype 1 or 3. Could genetic background explain the difference? APOE4 was equally represented across the groups, but Tijms did not correlate subtypes with other genetic markers. Lianne Reus, who works with both Tijms and Pieter Jelle Visser at Amsterdam VUMC, took up the challenge.
Reus correlated CSF proteomics with polygenic risk scores. PGS have become powerful gauges of AD risk, but they are difficult to interpret mechanistically. Reus believes coupling PGS with proteomic analysis could yield information about the underlying biological processes associated with genetic risk.
Reus determined polygenic scores for each person based on summary statistics from the genome-wide association study conducted by the International Genomics of Alzheimer’s Project (Jul 2013 conference news; Lambert et al., 2013). By using different significance thresholds for polymorphisms, she came up with 14 different polygenic scores for each of 250 subjects in ADNI, including 61 people with AD, 116 with MCI, and 73 controls. She related those scores to levels of peptide fragments in the CSF, looking for correlations with clusters of proteins.
From a query set of 412 peptides, Reus found that 199 correlated with PGS. They fell into three clusters. The first, comprising 68 proteins, was polygenic, associating with mostly high-risk single-nucleotide polymorphisms. This cluster contained proteins involved in Aβ pathology and complement, and correlated tightly with ApoE genotype. After correcting for ApoE, it still associated with polygenic risk scores. This means that more genes beyond ApoE contribute to Aβ pathology, said Reus. Twenty-one proteins made up cluster 2, which was intermediate on the polygenic scale. This cluster suggested no specific pathways, but it included markers associated with neuronal injury, including neurogranin, tau, phospho-tau, YKL40, and FABP. It also correlated with ApoE. Cluster 3 was the most polygenic. It did not correlate with ApoE genotype. It comprised cell-adhesion molecules and the AD-associated markers NfL, secretogranins 1, 2, and 3, chromogranin A, and VGF. Functionally, this pointed to cytokine-cytokine interactions.
“The data suggest that multiple genetic mechanisms lead to changes in AD CSF,” said Reus. She said it will be interesting to test how these CSF clusters can be modulated. “If we better understood the genetics behind these changes, we might be able to use them to more reliably monitor changes in clinical trials,” she said.
Choices, Choices … What to Do?
With all these potential markers at various stages of exploration, how can scientists determine which ones could become bona-fide markers? At AAIC, a collaboration of 13 biomarker leaders at five academic centers plus researchers at Lilly, Roche Diagnostics, and Genentech described their “NeuroTool Kit,” project. Led by Richard Batrla at Roche Diagnostics and Kaj Blennow, University of Gothenburg, Sweden, it aims to evaluate candidate markers in a coordinated way, so that the field can decide if they will work reliably in the clinic or should be abandoned.
The idea is to jointly choose candidate biomarkers based on current research needs, and then use standardized approaches to obtain comparable data for each of them across several well-defined cohorts. Such a dataset makes it easier than lots of individual single-center studies to determine a marker’s ability to differentially diagnose or track disease, or to monitor response to an investigational treatment.
In the end, a NeuroTool Kit could encompass all fluid markers validated for neurodegenerative diseases, much like scientists are building genotyping platforms that contain all known neurodegenerative risk variants for use in research and, eventually, in clinical diagnostics (e.g., Blauwendraat et al., 2017).
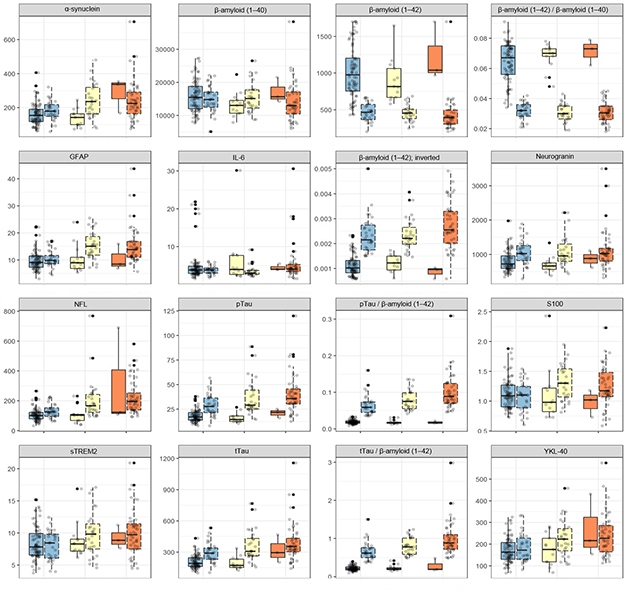
Which Ones Work? Twelve different markers, plus four ratios, were measured side-by side, in the same way, in the same normal (blue), MCI (yellow), and AD (orange) dementia samples of the WRAP cohort. Each sample is further subdivided as p-tau/Aβ42 negative (left) or positive (right). [Courtesy of Kaj Blennow.]
At AAIC, the scientists presented 16 side-by-side tests done on samples from the University of Wisconsin, Madison, ADRC research cohort. The 16 comprise 12 markers—including Aβ, p-tau, total tau, neurogranin, NfL, GFAP, sTREM2, YKL-40—plus four combinations. The same markers will be tested in additional cohorts, including the ALFA Plus cohort in Barcelona, Spain, the Parkinson’s Progression Marker Initiative, and Roche/Genentech’s ABBY and BLAZE clinical trial cohorts. Other markers up for consideration include NPTX2 (see Part 11 of this series), SNAP-25, TDP-43, BDNF, osteopontin, and various phosphorylated epitopes of tau.—Tom Fagan and Gabrielle Strobel
References
News Citations
- Synaptic Proteins in CSF: New Markers of Cognitive Decline?
- Two Proteins in Young Blood Give Synapses a SPARC
- Deep Blue for Aβ Blood Test?
- Alzheimer’s Proteomics Treasure Trove?
- Pooled GWAS Reveals New Alzheimer’s Genes and Pathways
Paper Citations
- Mattsson N, Insel P, Nosheny R, Zetterberg H, Trojanowski JQ, Shaw LM, Tosun D, Weiner M. CSF protein biomarkers predicting longitudinal reduction of CSF β-amyloid42 in cognitively healthy elders. Transl Psychiatry. 2013;3:e293. PubMed.
- Lambert JC, Ibrahim-Verbaas CA, Harold D, Naj AC, Sims R, Bellenguez C, DeStafano AL, Bis JC, Beecham GW, Grenier-Boley B, Russo G, Thorton-Wells TA, Jones N, Smith AV, Chouraki V, Thomas C, Ikram MA, Zelenika D, Vardarajan BN, Kamatani Y, Lin CF, Gerrish A, Schmidt H, Kunkle B, Dunstan ML, Ruiz A, Bihoreau MT, Choi SH, Reitz C, Pasquier F, Cruchaga C, Craig D, Amin N, Berr C, Lopez OL, De Jager PL, Deramecourt V, Johnston JA, Evans D, Lovestone S, Letenneur L, Morón FJ, Rubinsztein DC, Eiriksdottir G, Sleegers K, Goate AM, Fiévet N, Huentelman MW, Gill M, Brown K, Kamboh MI, Keller L, Barberger-Gateau P, McGuiness B, Larson EB, Green R, Myers AJ, Dufouil C, Todd S, Wallon D, Love S, Rogaeva E, Gallacher J, St George-Hyslop P, Clarimon J, Lleo A, Bayer A, Tsuang DW, Yu L, Tsolaki M, Bossù P, Spalletta G, Proitsi P, Collinge J, Sorbi S, Sanchez-Garcia F, Fox NC, Hardy J, Deniz Naranjo MC, Bosco P, Clarke R, Brayne C, Galimberti D, Mancuso M, Matthews F, European Alzheimer's Disease Initiative (EADI), Genetic and Environmental Risk in Alzheimer's Disease, Alzheimer's Disease Genetic Consortium, Cohorts for Heart and Aging Research in Genomic Epidemiology, Moebus S, Mecocci P, Del Zompo M, Maier W, Hampel H, Pilotto A, Bullido M, Panza F, Caffarra P, Nacmias B, Gilbert JR, Mayhaus M, Lannefelt L, Hakonarson H, Pichler S, Carrasquillo MM, Ingelsson M, Beekly D, Alvarez V, Zou F, Valladares O, Younkin SG, Coto E, Hamilton-Nelson KL, Gu W, Razquin C, Pastor P, Mateo I, Owen MJ, Faber KM, Jonsson PV, Combarros O, O'Donovan MC, Cantwell LB, Soininen H, Blacker D, Mead S, Mosley TH Jr, Bennett DA, Harris TB, Fratiglioni L, Holmes C, de Bruijn RF, Passmore P, Montine TJ, Bettens K, Rotter JI, Brice A, Morgan K, Foroud TM, Kukull WA, Hannequin D, Powell JF, Nalls MA, Ritchie K, Lunetta KL, Kauwe JS, Boerwinkle E, Riemenschneider M, Boada M, Hiltuenen M, Martin ER, Schmidt R, Rujescu D, Wang LS, Dartigues JF, Mayeux R, Tzourio C, Hofman A, Nöthen MM, Graff C, Psaty BM, Jones L, Haines JL, Holmans PA, Lathrop M, Pericak-Vance MA, Launer LJ, Farrer LA, van Duijn CM, Van Broeckhoven C, Moskvina V, Seshadri S, Williams J, Schellenberg GD, Amouyel P, Wang J, Uitterlinden AG, Rivadeneira F, Koudstgaal PJ, Longstreth WT Jr, Becker JT, Kuller LH, Lumley T, Rice K, Garcia M, Aspelund T, Marksteiner JJ, Dal-Bianco P, Töglhofer AM, Freudenberger P, Ransmayr G, Benke T, Toeglhofer AM, Bressler J, Breteler MM, Fornage M, Hernández I, Rosende Roca M, Ana Mauleón M, Alegrat M, Ramírez-Lorca R, González-Perez A, Chapman J, Stretton A, Morgan A, Kehoe PG, Medway C, Lord J, Turton J, Hooper NM, Vardy E, Warren JD, Schott JM, Uphill J, Ryan N, Rossor M, Ben-Shlomo Y, Makrina D, Gkatzima O, Lupton M, Koutroumani M, Avramidou D, Germanou A, Jessen F, Riedel-Heller S, Dichgans M, Heun R, Kölsch H, Schürmann B, Herold C, Lacour A, Drichel D, Hoffman P, Kornhuber J, Gu W, Feulner T, van den Bussche H, Lawlor B, Lynch A, Mann D, Smith AD, Warden D, Wilcock G, Heuser I, Wiltgang J, Frölich L, Hüll M, Mayo K, Livingston G, Bass NJ, Gurling H, McQuillin A, Gwilliam R, Deloukas P, Al-Chalabi A, Shaw CE, Singleton AB, Guerreiro R, Jöckel KH, Klopp N, Wichmann HE, Dickson DW, Graff-Radford NR, Ma L, Bisceglio G, Fisher E, Warner N, Pickering-Brown S. Meta-analysis of 74,046 individuals identifies 11 new susceptibility loci for Alzheimer's disease. Nat Genet. 2013 Dec;45(12):1452-8. Epub 2013 Oct 27 PubMed.
- Blauwendraat C, Faghri F, Pihlstrom L, Geiger JT, Elbaz A, Lesage S, Corvol JC, May P, Nicolas A, Abramzon Y, Murphy NA, Gibbs JR, Ryten M, Ferrari R, Bras J, Guerreiro R, Williams J, Sims R, Lubbe S, Hernandez DG, Mok KY, Robak L, Campbell RH, Rogaeva E, Traynor BJ, Chia R, Chung SJ, International Parkinson's Disease Genomics Consortium (IPDGC), COURAGE-PD Consortium, Hardy JA, Brice A, Wood NW, Houlden H, Shulman JM, Morris HR, Gasser T, Krüger R, Heutink P, Sharma M, Simón-Sánchez J, Nalls MA, Singleton AB, Scholz SW. NeuroChip, an updated version of the NeuroX genotyping platform to rapidly screen for variants associated with neurological diseases. Neurobiol Aging. 2017 Sep;57:247.e9-247.e13. Epub 2017 May 17 PubMed.
Further Reading
No Available Further Reading
Annotate
To make an annotation you must Login or Register.
Comments
No Available Comments
Make a Comment
To make a comment you must login or register.