Analysis of PET Scans Suggests Link Between Amyloid and Tau
Quick Links
The spread of Alzheimer’s disease pathology has puzzled researchers for decades. Autopsies show that amyloid plaques and neurofibrillary tangles accumulate in distinct locations decades before symptoms arise. Plaques accumulate in the temporal, parietal, and frontal lobes, whereas tau tangles appear first in the entorhinal cortex and later spread to medial and inferior temporal regions, eventually dotting the whole neocortex. Could the two pathologies really be unrelated? Where and how do they meet? A paper in the May 30 JAMA Neurology tries to chip away at the puzzle. Applying a mathematical tool that extracts patterns from large data sets in an unbiased, brain-wide manner, researchers led by Jorge Sepulcre and Keith Johnson at Massachusetts General Hospital, Boston, provide a new view. They find that tau deposition in large areas of the cortex correlates with both tau and Aβ pathology in other regions of the brain, linking the two pathologies at distant sites.
Prior PET analyses have hinted at possible long-distance interactions between Aβ and tau pathologies (e.g., Sepulcre et al., 2016; Lockhart et al., 2017). But most PET studies select regions of interest for voxel analysis that are based on staging or prior pathological analysis, noted Rik Ossenkoppele at VU University, Amsterdam, in an email to Alzforum (Cho et al., 2016; Johnson et al., 2016; Schöll et al., 2016; Schwarz et al., 2016).
Sepulcre and colleagues used hierarchical clustering, which assumes no a priori relationships among voxels in the brain, crunching all the data collectively. Using this approach, Sepulcre grouped voxels together based on how intensely they bound the PET ligands. Then he looked for correlations among all the clusters across the cohort. The authors hoped this might reveal associations not seen before and make it easier to spot distant interactions between different brain regions. “A major strength of the present study is that it is data-driven and does not introduce bias,” wrote Prashanti Vemuri at the Mayo Clinic in Rochester, Minnesota, and Michael Schöll, University of Gothenburg, Sweden, in an accompanying editorial.
The researchers analyzed brain images from 88 cognitively normal elderly people taking part in the ongoing Harvard Aging Brain Study. Everyone had had separate PET scans, up to 20 months apart (mean interval 5.3 months), using 11C-PiB for Aβ and 18F-T807 for tau. As expected for people in their mid-70s, 27 were amyloid-positive as judged by a distribution volume ratio of more than 1.2, a sign of heightened risk for AD.

Tau and amyloid landscapes.
Binding of T807 and PiB as grouped into four main clusters ranging from highest (red) to medium (green, blue) and lowest mean intensity (yellow). [Courtesy of Jorge Sepulcre, JAMA Neurology.]
To look for patterns and potential relationships between the Aβ and tau signals, the researchers first created a discovery data set from 30 randomly chosen individuals. Hierarchical clustering revealed four main clusters for T807 and four for PiB (see image at right). Tau cluster 1 mapped primarily to the temporal lobe and parts of the orbitofrontal cortex, roughly corresponding to regions known to develop tangles early in AD, whereas tau cluster 2 mapped to cortical association areas that typically develop tau pathology later (Braak and Braak, 1991). In the case of Aβ, cluster 1 covered wide swaths of cortex, including lateral tempoparietal and frontal regions, consistent with amyloid distribution in early AD. Lower-intensity clusters surrounded the high-intensity patches.
Using the data from the remaining 58 participants, the authors then correlated the intensity of each of the eight clusters to that of the other seven clusters from the same person. As expected, they found that the intensities of the tau clusters correlated with each other, as did the Aβ clusters. For example, when tau cluster 2 was high intensity in a given person, the other tau clusters were, too.
Intriguingly, the researchers found that the intensity of tau cluster 2, but no other tau cluster, correlated with the intensities of all Aβ clusters in the same person (see image below). They hypothesized that tau cluster 2 may be somehow linked to Aβ plaques throughout the cortex. But paradoxically, they found that tau cluster 2 correlated less with Aβ cluster 1, with which it spatially overlaps, than with the other Aβ clusters. Importantly, they concluded from this that any coordinated accumulation of tau and Aβ likely occurs across distantly connected brain systems rather than adjacent ones.
Beau Ances at Washington University in St. Louis was encouraged by the results. He noted that the identification of tau cluster 2 is consistent with an idea several groups have proposed, namely that “tau hubs” may be key to the spread of disease.
Moreover, the data may offer clues as to how that spread happens. Tau cluster 1 covered a smaller area than cluster 2 but had a higher density of tangles, leading the authors to suggest that tau pathology might be spreading from the former to the latter. Since these clusters are not adjacent, the authors posit that tau pathology travels both locally and to more distant regions of the cortex. “We don’t have data that can determine directionality, but we can infer based on the spatial distribution, neural connectivity, and cross-sectional data from people at different stages of preclinical disease,” Sepulcre said.
In contrast, low-intensity Aβ clusters predominantly apposed the high-intensity clusters, suggesting this pathology expands locally into its immediate vicinity.
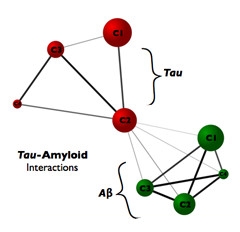
Pulling it together.
Tau cluster 2, which mapped to areas of the association cortex, correlated with the signal of both tau and amyloid clusters, suggesting cluster 2 could be a link between the two pathologies. [Courtesy of Jorge Sepulcre.]
How tau and Aβ pathologies affect each other remains unclear. Sepulcre speculated that tau in the association cortex could drive disease, since that cluster correlates with the others. “I think having one cluster influence many is more likely than having many influence one,” he said. This would fit with AD being a “tau-centered disease with amyloid effects,” noted the authors, even though they cautioned that Aβ in different clusters could induce tau deposits in one single cluster. “Thus, in our opinion, the directionality question remains open and should be addressed using longitudinal study designs as soon as these data become available,” they wrote. Ances agreed this tau-centered concept is worth pursuing.
Researchers caution that not only longitudinal studies but independent and larger cohorts are needed to confirm the suggested links and progression of Aβ and tau pathology. David Jones at the Mayo Clinic in Rochester, Minnesota, noted that some common patterns of AD-related tau pathology seen in frontoparietal and visual areas of the cortex, for example, weren’t revealed in this study, probably because the cohort included only 27 amyloid-positive people. Jones has found four or five areas of tau pathology that correlate with Aβ deposits. “These areas are heterogeneous, found in only some people, and with different spatial patterns,” he said.
Researchers also suggested comparing different analytical approaches. Both Ances and Ossenkoppele said that other PET studies reported different tau patterns to those found by Sepulcre and colleagues (e.g., Mar 2016 news). Ossenkoppele said that hierarchical clustering captures such a wealth of information that it may outperform more traditional PET analysis (see comment below). Jones encouraged comparisons with other data analysis methods. “Defining clusters is a bit of an art form,” he said. “All clustering techniques have some assumptions and biases. That’s why we like to use several methods and then compare results.”
Looking ahead, Sepulcre said his findings may improve early staging and prognosis. To that end, he plans to correlate imaging data and genetic markers of disease.—Marina Chicurel
References
News Citations
Paper Citations
- Sepulcre J, Schultz AP, Sabuncu M, Gomez-Isla T, Chhatwal J, Becker A, Sperling R, Johnson KA. In Vivo Tau, Amyloid, and Gray Matter Profiles in the Aging Brain. J Neurosci. 2016 Jul 13;36(28):7364-74. PubMed.
- Lockhart SN, Schöll M, Baker SL, Ayakta N, Swinnerton KN, Bell RK, Mellinger TJ, Shah VD, O'Neil JP, Janabi M, Jagust WJ. Amyloid and tau PET demonstrate region-specific associations in normal older people. Neuroimage. 2017 Apr 15;150:191-199. Epub 2017 Feb 21 PubMed.
- Cho H, Choi JY, Hwang MS, Kim YJ, Lee HM, Lee HS, Lee JH, Ryu YH, Lee MS, Lyoo CH. In vivo cortical spreading pattern of tau and amyloid in the Alzheimer disease spectrum. Ann Neurol. 2016 Aug;80(2):247-58. Epub 2016 Jul 8 PubMed.
- Johnson KA, Schultz A, Betensky RA, Becker JA, Sepulcre J, Rentz D, Mormino E, Chhatwal J, Amariglio R, Papp K, Marshall G, Albers M, Mauro S, Pepin L, Alverio J, Judge K, Philiossaint M, Shoup T, Yokell D, Dickerson B, Gomez-Isla T, Hyman B, Vasdev N, Sperling R. Tau positron emission tomographic imaging in aging and early Alzheimer disease. Ann Neurol. 2016 Jan;79(1):110-9. Epub 2015 Dec 15 PubMed.
- Schöll M, Lockhart SN, Schonhaut DR, O'Neil JP, Janabi M, Ossenkoppele R, Baker SL, Vogel JW, Faria J, Schwimmer HD, Rabinovici GD, Jagust WJ. PET Imaging of Tau Deposition in the Aging Human Brain. Neuron. 2016 Mar 2;89(5):971-82. PubMed.
- Schwarz AJ, Yu P, Miller BB, Shcherbinin S, Dickson J, Navitsky M, Joshi AD, Devous MD Sr, Mintun MS. Regional profiles of the candidate tau PET ligand 18F-AV-1451 recapitulate key features of Braak histopathological stages. Brain. 2016 May;139(Pt 5):1539-50. Epub 2016 Mar 2 PubMed.
- Braak H, Braak E. Neuropathological stageing of Alzheimer-related changes. Acta Neuropathol. 1991;82(4):239-59. PubMed.
Further Reading
Papers
- Cho H, Choi JY, Hwang MS, Kim YJ, Lee HM, Lee HS, Lee JH, Ryu YH, Lee MS, Lyoo CH. In vivo cortical spreading pattern of tau and amyloid in the Alzheimer disease spectrum. Ann Neurol. 2016 Aug;80(2):247-58. Epub 2016 Jul 8 PubMed.
- Vemuri P, Lowe VJ, Knopman DS, Senjem ML, Kemp BJ, Schwarz CG, Przybelski SA, Machulda MM, Petersen RC, Jack CR Jr. Tau-PET uptake: Regional variation in average SUVR and impact of amyloid deposition. Alzheimers Dement (Amst). 2017;6:21-30. Epub 2016 Dec 21 PubMed.
- Johnson KA, Schultz A, Betensky RA, Becker JA, Sepulcre J, Rentz D, Mormino E, Chhatwal J, Amariglio R, Papp K, Marshall G, Albers M, Mauro S, Pepin L, Alverio J, Judge K, Philiossaint M, Shoup T, Yokell D, Dickerson B, Gomez-Isla T, Hyman B, Vasdev N, Sperling R. Tau positron emission tomographic imaging in aging and early Alzheimer disease. Ann Neurol. 2016 Jan;79(1):110-9. Epub 2015 Dec 15 PubMed.
Primary Papers
- Sepulcre J, Grothe MJ, Sabuncu M, Chhatwal J, Schultz AP, Hanseeuw B, El Fakhri G, Sperling R, Johnson KA. Hierarchical Organization of Tau and Amyloid Deposits in the Cerebral Cortex. JAMA Neurol. 2017 Jul 1;74(7):813-820. PubMed.
- Vemuri P, Schöll M. Linking Amyloid-β and Tau Deposition in Alzheimer Disease. JAMA Neurol. 2017 Jul 1;74(7):766-768. PubMed.
Annotate
To make an annotation you must Login or Register.
Comments
VU University Medical Center
Jorge Sepulcre and colleagues have performed an elegant voxel-wise hierarchical clustering approach to [11C]PIB (Aβ) and [18F]flortaucipir (tau) PET data, in order to investigate the cortical distribution of the two AD hallmark pathologies in 88 cognitively normal individuals. Using silhouette analysis (i.e., assessment of the number of voxels within and outside the hierarchical cluster and of cluster stability) the optimum number of clusters turned out to be four for both PET tracers. There were notable differences in the distribution, intensity, and size of Aβ and tau clusters, providing important information about the spatial relationships between Aβ and tau pathology in a clinically normal population. There are many interesting observations made in this dense paper, of which I will highlight a few.
1. To date, most studies employing tau PET tracers (Cho et al., 2016; Johnson et al., 2016; Schöll et al., 2016; Schwarz et al., 2016) have selected regions of interest (ROIs) or derivatives based on neuropathological staging of tau pathology [i.e., Braak NFT staging, (Braak and Braak, 1991)]. Computationally extracting detailed regional information with full brain coverage is an advantage of neuroimaging over neuropathologic data, however, and provides the unique opportunity to capture tau pathology in the living human brain. An advantage of clustering (or any data-driven approach) is that it has the potential to identify distinct sources in the signal (i.e., target and noise). It is encouraging that the identified hierarchical clusters (specifically no. 1 and no. 2) seem biologically meaningful as they include brain regions that are vulnerable in both early (cluster no. 1) and more advanced (cluster no. 2) stages of AD. Logical next steps would be to investigate whether the identified clusters are stable across cohorts (i.e., external validation) and in different clinical populations (e.g., MCI or AD dementia patients).
2. Related to the above, there was some overlap between the hierarchical tau clusters and traditional neurofibrillary tangles (NFTs) Braak stage areas. Cluster no. 1 partially mapped onto areas affected in Braak stages I-IV (medial temporal lobe, inferior temporal cortex and orbitofrontal cortex), while cluster no. 2 showed some overlap with Braak stage V/VI (isocortical regions). The correspondence is imperfect, however, because there are substantial differences between the data-driven clusters in this study and neuropathologically-derived ROIs. In light of ongoing efforts to define tau PET-positivity, it is important to test whether the identified hierarchical clusters yield greater predictive accuracy for cognitive status and brain atrophy compared to traditional, neuropathologically derived tau clusters. It might very well be that agnostic, data-driven approaches outperform theory-driven ROIs due to the abundance of information available in neuroimaging data.
3. Figure 3 nicely highlights different features of Aβ and tau clusters. For tau PET, the highest signal intensity was found in a rather constrained cluster (no. 1) that typically shows early signs of neurodegeneration (e.g., medial temporal lobe structures), while the greatest total signal was found in the larger cluster (no. 2) comprising frontoparietal and lateral occipital regions. For Aβ PET, however, both intensity and total signal was highest in the same large cluster (no. 1) of heteromodal association regions. This suggests a separation in space (and possibly time) between Aβ and tau pathology, and that the location of high-intensity tau pathology might dictate where neurodegeneration will occur. This needs to be tested in future longitudinal studies.
References:
Braak H, Braak E. Neuropathological stageing of Alzheimer-related changes. Acta Neuropathol. 1991;82(4):239-59. PubMed.
Cho H, Choi JY, Hwang MS, Kim YJ, Lee HM, Lee HS, Lee JH, Ryu YH, Lee MS, Lyoo CH. In vivo cortical spreading pattern of tau and amyloid in the Alzheimer disease spectrum. Ann Neurol. 2016 Aug;80(2):247-58. Epub 2016 Jul 8 PubMed.
Johnson KA, Schultz A, Betensky RA, Becker JA, Sepulcre J, Rentz D, Mormino E, Chhatwal J, Amariglio R, Papp K, Marshall G, Albers M, Mauro S, Pepin L, Alverio J, Judge K, Philiossaint M, Shoup T, Yokell D, Dickerson B, Gomez-Isla T, Hyman B, Vasdev N, Sperling R. Tau positron emission tomographic imaging in aging and early Alzheimer disease. Ann Neurol. 2016 Jan;79(1):110-9. Epub 2015 Dec 15 PubMed.
Schöll M, Lockhart SN, Schonhaut DR, O'Neil JP, Janabi M, Ossenkoppele R, Baker SL, Vogel JW, Faria J, Schwimmer HD, Rabinovici GD, Jagust WJ. PET Imaging of Tau Deposition in the Aging Human Brain. Neuron. 2016 Mar 2;89(5):971-82. PubMed.
Schwarz AJ, Yu P, Miller BB, Shcherbinin S, Dickson J, Navitsky M, Joshi AD, Devous MD Sr, Mintun MS. Regional profiles of the candidate tau PET ligand 18F-AV-1451 recapitulate key features of Braak histopathological stages. Brain. 2016 May;139(Pt 5):1539-50. Epub 2016 Mar 2 PubMed.
Mayo Clinic and Foundation
While the early results are very encouraging, it would be great to see the hierarchical clustering approach implemented in a larger sample, as well as with the inclusion of cognitively impaired individuals to ensure that the complete range of outcome values for amyloid and tau are included.
Make a Comment
To make a comment you must login or register.