Phospho-tau/tau Ratios: Better Markers than Absolute p-Tau Levels?
Quick Links
Evidence continues to build for how well phospho-tau species in the cerebrospinal fluid or blood detect amyloid plaques, neurofibrillary tangles, and even neurodegeneration. The latest, from scientists led by Nicolas Barthélemy and Suzanne Schindler at Washington University in St. Louis, suggests that the phosphorylation occupancy at certain tau amino acids, i.e. the p-tau/tau ratio at those sites, detects pathology better than does the p-tau concentration alone. In the March 13 Nature Aging, they reported that CSF p-tau217/tau217 correlates tightly with amyloid PET, even outdoing the Aβ42/40 ratio. CSF p-tau205/tau205, on the other hand, correlated poorly with plaques but very well with tau PET and with regional brain atrophy, making it a good marker for tangles and neurodegeneration.
- CSF p-tau217/tau217 better predicts amyloid than does p-tau217 or Aβ42/40.
- CSF p-tau205/tau205 is the best correlate of tau PET and atrophy.
- Both p-tau/tau ratios tracked dementia symptoms almost as well as did tau PET.
Henrik Zetterberg of the University of Gothenburg, Sweden, said this work was well done. “These ratios correct for interindividual variation in CSF marker production and clearance, and in CSF volume, all of which alter biomarker concentrations,” he told Alzforum. Rik Ossenkoppele of Amsterdam University Medical Center thinks the findings are robust. “While most CSF tau biomarkers are related to amyloid pathology or a mix of amyloid and tau pathologies, this paper shows that p-tau205 is most strongly associated with tau PET,” he said. “This is part of the emerging evidence that some CSF tau markers are specific to tau pathology.”
Previously, Barthélemy had found that, in people with familial AD, CSF p-tau217/tau217 most strongly correlated with amyloid PET, while p-tau205/tau205 was a better marker of tau PET, brain atrophy, and hypometabolism (Mar 2020 news). To see if this held true in sporadic AD, he measured p-tau/tau ratios in CSF from 750 people in the Knight AD Research Center cohort. Of those, 120 had mild cognitive impairment; the rest were cognitively normal. Participants were 71 years old on average. Half were women; 90 percent were Caucasian. All participants had amyloid PET scans; 371 had tau PET scans as well. The researchers verified their findings in 90 people from the Swedish BioFINDER-2 cohort, all of whom had MCI or AD dementia.
Tau isoforms measured included peptides phosphorylated at 10 residues: 111, 153, 175, 181, 199, 202, 205, 208, 217, and 231. Barthélemy calculated the p-tau/tau ratios for each, using concentrations of non-phosphorylated fragments that spanned all 10 residues.
Which marker best predicted plaque load? The p-tau217/tau217 ratio outperformed all others, correlating with amyloid PET Centiloids at a coefficient of 0.76. CSF p-tau217 alone correlated with plaque load with a coefficient of 0.71. The 217 ratio even edged out CSF Aβ42/40 at -0.74 (see image below). Aβ42 falls in the CSF as plaques accumulate.
Notably, p-tau217/tau217 not only denoted who was amyloid-positive but also how much amyloid they had. “CSF Aβ42/40 plateaus once someone crosses the positivity threshold, while p-tau217/tau217 keeps rising in amyloid-positive people, better reflecting total amyloid burden,” Schindler said (image below). Scientists have previously noted that the wider dynamic range of p-tau/tau over the Aβ42/40 ratio may make the former better markers (Aug 2019 news).
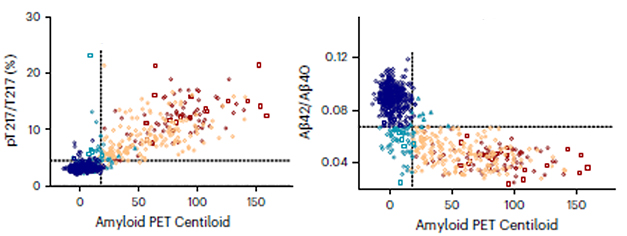
Rival Ratios. CSF p-tau217/tau217 (left) correlated with amyloid PET better than did CSF Aβ42/40 (right). [Courtesy of Barthélemy et al., Nature Aging, 2023.]
CSF p-tau217/tau217 and p-tau217 alone also strongly predicted the presence of neurofibrillary tangles, with areas under the curve of 0.96 and 0.95, respectively. AUC measures sensitivity and specificity, with 1 being a perfect score. This indicates that absolute p-tau217 values are sometimes just as good at detecting tangles as occupancy at that threonine residue.
In contrast to the 217 occupancy, the CSF p-tau205/tau205 ratio weakly associated with amyloid PET. For tau PET, however, it rivaled p-tau217/tau217, predicting a positive PET scan with an AUC of 0.94. The absolute concentration of p-tau205 did a smidge better with an AUC of 0.96. The 205 occupancy also most strongly correlated with tau PET tracer uptake in, and atrophy of, the amygdala and temporal regions, areas where tangles gather early in AD (see image below). The authors concluded that p-tau205/tau205 was the best marker of tangles and neurodegeneration.
CSF p-tau181/tau181 and p-tau231/tau231 weakly correlated with plaque and tangle load and did not correlate with brain volume.

Tangles and Atrophy. Among four phosphorylation sites in tau, occupancy at threonine 205 best correlated with regional tau PET (left) and regional brain atrophy (right) measured via structural MRI. CSF p-tau217/tau217 correlated well with tangles but poorly with atrophy, while p-tau231/tau231 and p-tau181/tau181 were poor markers of either pathology. [Courtesy of Barthélemy et al., Nature Aging, 2023.]
What about cognition? The 217 and 205 occupancies distinguished cognitively impaired participants, based on their Clinical Dementia Rating scale scores, with AUCs of 0.84 and 0.81, respectively. This rivaled the AUC of 0.85 for tau PET.
Intriguingly, with an AUC of 0.88, the CSF p-tau205/tau205 ratio most accurately distinguished tangle positivity among the 125 amyloid-positive people. CSF p-tau217/tau217 was the next-best ratio, with an AUC of 0.83. “[P-tau205 occupancy] is very good at distinguishing tau pathology, particularly in people who are amyloid-PET-positive,” Schindler said. Such strong ability to identify amyloid- and tau-positive people made her wonder if a lumbar puncture to measure tau ratios could replace the more expensive PET scans typically used to screen people for clinical trials.
Time to Change the ATN Framework?
The findings could have implications for the amyloid-tau-neurodegeneration (ATN) framework for AD biomarkers that has been used since 2018 (Apr 2018 news). This system uses the CSF Aβ42/40 ratio as a marker for plaques, CSF p-tau181 or tau PET for tangles, and CSF total tau or neurofilament light for neurodegeneration. Others have suggested that ATN be updated to account for new p-tau biomarker analyses, suggesting the acronym APTN as multiple p-tau isoforms rise after Aβ markers become positive but before tau PET detects tangles (Sep 2022 news).
Schindler and colleagues think the time might be right to update the markers for each. Since CSF p-tau217/tau217 outperformed CSF Aβ42/40, it could be used as a marker of amyloid. CSF p-tau205/tau205 could measure both tangles and neurodegeneration, the authors suggest.
Still, other researchers are not yet ready to part with the current ATN markers, wanting to see more evidence that the p-tau occupancies truly outperform Aβ42/40 and absolute p-tau isoforms. “I think it is too early to dismiss Aβ42/40 and p-tau181, but p-tau217 and perhaps p-tau205/tau205 could be used as add-ons to a diagnostic panel,” wrote Inge Verberk, Amsterdam University Medical Center (full comment below).
Tharick Pascoal of the University of Pittsburgh thinks p-tau markers should not be used as a proxy for amyloid, because the Aβ42/40 and p-tau/tau ratios represent different biological processes. Zetterberg favors keeping the Aβ42/40 ratio for a different reason (full comment below). “Having an amyloid marker avoids the possible contamination issue of non-AD increases in total tau, such as small strokes or traumatic brain injuries,” he noted. Such a rise in total, but not p-tau, would skew phosphorylation site occupancies lower, potentially masking the presence of AD pathology.
Schindler noted that such spikes in total tau may be transient and normalize after injury. “The fact that some of the measures are so highly accurate, e.g., p-tau217/tau217, suggests that comorbidities do not have a big effect on them, since some of the participants inevitably had comorbidities,” she told Alzforum.
Adding another twist to the tau plot, Zetterberg and Kaj Blennow, also from U Gothenburg, recently found that p-tau/tau ratios offered no improvement over p-tau concentrations alone in detecting AD pathology (Gobom et al., 2022). “It is clear that we see better performance if we absolutely quantify each peptide than if we measure p-tau/tau occupancies, while they see better performance for the ratio,” Blennow wrote to Alzforum. “It’s hard to say why, but it’s likely methodological. We need more studies on [p-tau occupancies].” Recently, Robert Rissman, University of California, San Diego, also reported that absolute value and ratios of phosphorylated tau at residues 181 and 217 identified amyloid-positive people in the Ahead trial equally well (Dec 2022 news).
How does all this tie in with blood biomarkers, which attract much more attention because they are easier to measure than CSF markers in a routine clinical setting? Could plasma p-tau217/tau217 and p-tau205/tau205 be as predictive as their CSF counterparts? Zetterberg thinks so, but worries that peripheral tau may muddy the waters. He suggested using measures of brain-derived isoforms of tau to skirt this potential problem. These tau fragments are spliced together only in the brain, and researchers recently developed an immunoassay to detect them (Dec 2022 conference news). Their plasma levels might be helpful to normalize plasma p-tau occupancies to brain tau.
Barthélemy is working out the kinks of measuring p-tau/tau ratios in plasma. Confounds include the much lower tau concentration and the much more complex milieu of biomolecules. “Plasma p-tau217/tau217 detection is working really well, but p-tau205/tau205 is a little more challenging because there is less of it,” he told Alzforum.—Chelsea Weidman Burke
References
News Citations
- Different CSF Phospho-Taus Match Distinct Changes in Brain Pathology
- Move Over CSF, P-Tau in Blood Also Tells Us There’s Plaque in the Brain
- New Definition of Alzheimer’s Hinges on Biology, Not Symptoms
- Scientists Say It's Time to Update ATN Criteria
- Plasma P-tau217 Picks Up Plaques, Tangles, Future Decline
- Better Diagnosis with Blood Test Detecting Only Tau Made in Brain
Paper Citations
- Gobom J, Benedet AL, Mattsson-Carlgren N, Montoliu-Gaya L, Schultz N, Ashton NJ, Janelidze S, Servaes S, Sauer M, Pascoal TA, Karikari TK, Lantero-Rodriguez J, Brinkmalm G, Zetterberg H, Hansson O, Rosa-Neto P, Blennow K. Antibody-free measurement of cerebrospinal fluid tau phosphorylation across the Alzheimer's disease continuum. Mol Neurodegener. 2022 Dec 12;17(1):81. PubMed.
Further Reading
No Available Further Reading
Primary Papers
- Barthélemy NR, Saef B, Li Y, Gordon BA, He Y, Horie K, Stomrud E, Salvadó G, Janelidze S, Sato C, Ovod V, Henson RL, Fagan AM, Benzinger TL, Xiong C, Morris JC, Hansson O, Bateman RJ, Schindler SE. CSF tau phosphorylation occupancies at T217 and T205 represent improved biomarkers of amyloid and tau pathology in Alzheimer's disease. https://doi.org/10.1038/s43587-023-00380-7 PubMed. Nature Aging
Annotate
To make an annotation you must Login or Register.
Comments
University of Pittsburgh
This is a very well-conducted and comprehensive study (of more than 20 tau measures) comparing CSF markers with AD pathophysiology measured by PET. This CSF study aligns with recent blood literature, suggesting that p-tau assays strongly correlate with and may represent both Aβ- and tau PET.
They add that CSF tau217 and 205 occupancies (phosphorylated/non-phosphorylated) are more closely related to PET than simple concentrations. This is a great advantage of the MS technique in that it allows simultaneous measurements of markers, increasing the reliability of ratios. On the other hand, most other platforms will likely be unable to accurately measure occupancy, and it adds a layer of work to MS assessment. Thus, a trade-off between the magnitude of improvement and caveats will play a role in future utility.
On the impact of the results on the ATN scheme, I don't think there are any major implications right now. CSF p-tau has already been added as a marker of tau pathology and if no epitopes other than 181 were mentioned it is likely because there was not much data on them at the time. I don't think the scheme intended to focus on 181. Also, I do not think that p-tau biomarkers should be added as a proxy for Aβ in canonical research biomarker schemes such as ATN, because they do not represent the same biological process, and this could lead to potentially incorrect assumptions cascading through studies relying on the schema.
Regarding clinical application, it seems clear from the results that CSF p-tau217 occupancy outperforms CSF p-tau181 and could also outperform CSF Aβ to identify AD. A recent study showed a mismatch between CSF Aβ and p-tau181, demonstrating, in postmortem data, a greater sensitivity of CSF Aβ to autopsy-confirmed AD (Vromen et al., 2023). Further similar studies using the new p-tau assays anchored in postmortem data would provide valuable information to ascertain the additive performance of these new high-performance assays to identify AD.
References:
Vromen EM, de Boer SC, Teunissen CE, Rozemuller A, Sieben A, Bjerke M, Alzheimer’s Disease Neuroimaging Initiative, Visser PJ, Bouwman FH, Engelborghs S, Tijms BM. Biomarker A+T-: is this Alzheimer's disease or not? A combined CSF and pathology study. Brain. 2022 May 2; PubMed.
VU University Medical Center
This is a very interesting study by Barthélemy et al., in which several non-phosphorylated and phosphorylated tau species in the CSF were compared head-to-head. An important strength of the study design is that they were all simultaneously measured with mass spectrometry, which means there are no different antibodies and assay components affecting the comparison of the tau species.
The authors found that p-tau217/tau217 ratio associated stronger with amyloid PET status than did Aβ42/Aβ40. The surprise was CSF p-tau205/tau205, which correlated very strongly with tau PET, but interestingly, this CSF measure was not so strongly correlated with amyloid PET.
Should we revisit the ATN criteria already, and select p-tau217/tau217 as an “A” biomarker and CSF p-tau205/tau205 as a “T” biomarker? CSF and blood studies consistently show that p-tau217 might be the supreme biomarker, for both A and T. It might be time to start implementing this biomarker in clinical practice. I think it is too early to dismiss Aβ42/Aβ40 and p-tau181, but p-tau217 and perhaps p-tau205/tau205 could be add-ons to the diagnostic panel. Data is still accumulating, and performance of these new tau biomarkers should first be extensively tested in real-world settings. Also, robust (immuno)assays on high-throughput methodologies with a steady chain of supply should be in place.
Make a Comment
To make a comment you must login or register.