High-Resolution Map of Hippocampus Reveals Multiple Subnetworks
Quick Links
Despite reams of research on the hippocampus, scientists still know relatively little about its internal organization. Anatomists divide the hippocampal formation into six regions, but most functional studies define only two main networks, the dorsal and ventral. Now, the first neuronal-connectivity study to zoom in to the cellular level reports that the mouse hippocampus can in fact be divided into 22 discrete subregions. To find them, researchers led by Michael Bienkowski and Hong-Wei Dong at the University of Southern California, Los Angeles, compared gene expression and connectivity cell by cell. They discovered that both types of data delineated the same set of unique molecular domains.
- The hippocampus contains 22 subregions with unique patterns of gene expression and connectivity.
- These regions wire into subnetworks and networks in a hierarchical fashion.
- Connections to other brain regions hint at how the hippocampus regulates behavior.
“The biggest surprise was that gene expression and connectivity patterns lined up extremely well,” Bienkowski told Alzforum. The authors detail a hierarchical organization, where subregions link together into subnetworks, which then wire up to form the two large functional networks of the hippocampus. The data appeared in the October 8 Nature Neuroscience.
“This is a technical tour de force with remarkably new and detailed information on the organization of the mouse hippocampus and its relationship to the remainder of the brain. Its true value to the scientific community will likely play out over many years,” Marcus Raichle at Washington University in St. Louis wrote to Alzforum. He was not involved in the work.

Unique Connections.
Retrograde tracers injected into subregions CA1dr (gold), CA1dc (blue), and CA1i/CA1v (magenta) ended up in discrete regions—CA3dd, CA3d, and CA3v, respectively. [Courtesy of Bienkowski et al., Nature Neuroscience.]
The six anatomical regions of the hippocampal formation are the dentate gyrus, CA4, CA3, CA2, CA1, and the subiculum. Previous wiring studies in rats did not suggest sharp boundaries between these regions, finding instead a complex gradient of different wiring patterns across the hippocampus that resulted in distinct inputs and outputs for the dorsal versus the ventral portions (Swanson and Cowan, 1977; Amaral, 1993). How would those classic wiring studies dovetail with gene expression patterns? The Allen Brain Atlas now provides detailed in situ hybridization data for thousands of genes throughout the mouse brain, allowing researchers to discern more refined organizational schemes.
Bienkowski and colleagues selected 258 genes that were differentially expressed across the hippocampus. These genes defined 20 subregions with unique expression patterns. The authors named each subregion based on its dorsal, intermediate, or ventral location within hippocampal regions. They found three subregions in the dentate gyrus (dubbed DGd, DGi, and DGv), two in CA4 (also called the polymorph layer of the dentate gyrus, so the names are DGpod and DGpov), five in CA3 (CA3dd, CA3d, CA3i, CA3v, and CA3vv), one in CA2, four in CA1 (CA1d, CA1i, CA1v, and CA1vv), and five in the subiculum (SUBdd, SUBdv, SUBv, SUBvv, and ProSUB).
“The patterns suggested the existence of hidden domains in the hippocampus we couldn’t observe just by looking at the neurons,” Bienkowski told Alzforum. He noted that a separate analysis of more than 32,000 mouse genes produced the same clustering pattern, indicating the expression of the 258 selected genes was sufficient to reveal hippocampal organization.

Finely Diced.
Connectivity and gene expression data allowed researchers to identify discrete hippocampal subregions within each anatomical region. [Courtesy of Bienkowski et al., Nature Neuroscience.]
The authors used these gene expression patterns to guide injections of fluorescently labeled anterograde and retrograde tracers into specific subregions. Neurons then trafficked these tracers either up or down axonal tracts to light up connecting brain regions. To the author’s surprise, labeled areas of the hippocampus lined up exactly with other gene expression domains. For example, retrograde tracers injected into CA1v showed up throughout CA3i and CA3v, but not in other subregions (see image above). By injecting tracers into each subregion in turn, the authors were able to determine all inputs and outputs to each. The resulting pattern revealed a unique set of connections for each subregion. The only exceptions were that CA1d had a different combination of inputs and outputs in its rostral and caudal portions, suggesting this subregion could be further divided into CA1dr and CA1dc, while CA3i split into dorsal and caudal regions with distinct connectivity, CA3id and CA3ic. Altogether, the tracer data defined a total of 22 separate hippocampal subregions.
Refined Structure. New research subdivides the hippocampus into 22 distinct regions (colored portions). [Movie courtesy of Tyler Ard, USC Mark and Mary Stevens Neuroimaging and Informatics Institute.]
Further analysis of the connectivity patterns revealed that the 22 subregions wired together into seven subnetworks, four in the dorsal hippocampus and three in the ventral (see image below). The dorsal subnetworks linked up to form the classical dorsal network, believed to control spatial navigation and cognition, while the ventral subnetworks contributed to the ventral network associated with emotional behavior.
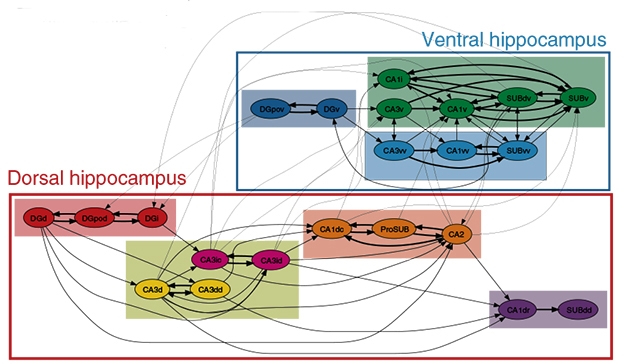
Network Hierarchy. Mouse hippocampal subregions (circles) form local networks (colored rectangles), which join into two larger networks (boxes). [Courtesy of Bienkowski et al., Nature Neuroscience.]
In addition to these intra-hippocampal networks, the authors found that distinct subregions of CA1, CA2, and the subiculum integrated into three brain-wide networks. In the first of these, CA1dr, SUBdv, and SUBdd projected to regions of the thalamus, mammillary nucleus, and parasubiculum. These hippocampal regions contain place cells and grid cells, neurons known to encode spatial information, and the brain regions they project to are populated with neurons sensitive to the orientation of the head (for review see Taube, 2007). The findings imply this brain-wide network guides spatial navigation, the authors noted.
The second brain-wide network includes the whole CA2 as well as CA1dc, CA1i, CA1v, SUBv, and ProSUB, and connects to the medial prefrontal cortex, amygdala, nucleus accumbens, and hypothalamus. These hippocampal subregions encode social memory, while the connecting regions of the amygdala and hypothalamus control fear responses. Likely, this network helps determine social behavior, the authors suggested.
The final brain-wide network involves CA1vv and SUBvv projecting to distinct regions of the amygdala and hypothalamus, as well as to the basal forebrain. These brain regions regulate metabolism and endocrine functions, including sexual behaviors.
Finally, portions of the subiculum appeared capable of integrating cognitive and emotional responses, with the prosubiculum receiving internal signals from the dorsal hippocampus and sending them to limbic brain regions such as the amygdala and hypothalamus, while SUBdv received signals from ventral hippocampus and passed them on to visuospatial cortex. This connectivity may allow mice to incorporate emotional and spatial feedback into their behavior, the authors speculated.
In future research, Bienkowski plans to test these hypotheses about network function by developing transgenic mouse lines in which he can stimulate or inhibit neurons in a single subregion (Nov 2012 news series). He will also see how well the findings translate to people, by examining hippocampal gene expression and connectivity in postmortem brain samples.
If a similar hippocampal organization occurs in the human brain, it might provide an additional perspective for Alzheimer’s research, Bienkowski suggested. For example, studies have found that anterior regions of the hippocampus degenerate first in AD. These regions correspond to ventral hippocampus in the mouse, hinting that they may control metabolism and homeostasis. That could lead researchers to look for metabolic biomarkers that might flag the early stages of AD, Bienkowski suggested. He also plans to extend his connectivity study to the entorhinal cortex, which is the first area to atrophy in AD. Those data could provide more clues to disease progression.
Bienkowski believes that studies that integrate different types of data hold great promise for understanding how the brain influences behavior. “It’s critical that we start to bridge the gaps between these different levels of neuroscience, and try to come up with a clear picture of how the whole system works together,” he said.—Madolyn Bowman Rogers
References
Series Citations
Paper Citations
- Swanson LW, Cowan WM. An autoradiographic study of the organization of the efferent connections of the hippocampal formation in the rat. J Comp Neurol. 1977 Mar 1;172(1):49-84. PubMed.
- Amaral DG. Emerging principles of intrinsic hippocampal organization. Curr Opin Neurobiol. 1993 Apr;3(2):225-9. PubMed.
- Taube JS. The head direction signal: origins and sensory-motor integration. Annu Rev Neurosci. 2007;30:181-207. PubMed.
External Citations
Further Reading
Primary Papers
- Bienkowski MS, Bowman I, Song MY, Gou L, Ard T, Cotter K, Zhu M, Benavidez NL, Yamashita S, Abu-Jaber J, Azam S, Lo D, Foster NN, Hintiryan H, Dong HW. Integration of gene expression and brain-wide connectivity reveals the multiscale organization of mouse hippocampal networks. Nat Neurosci. 2018 Nov;21(11):1628-1643. Epub 2018 Oct 8 PubMed.
Annotate
To make an annotation you must Login or Register.
Comments
No Available Comments
Make a Comment
To make a comment you must login or register.