Tracking Onset and Progression of Frontotemporal Dementia
Quick Links
Now that initiatives such as ARTFL and LEFFTDS have gathered sufficient numbers of participants for scientists to tackle prevention and treatment trials (see Part 2 of this conference series), the need for better tools to track onset and progression of disease has become pressing. At the 11th International Congress on Frontotemporal Dementia, held November 11–14 in Sydney, scientists proposed clinical and imaging tests that might be used to monitor changes early in disease.
- Researchers look for new ways to detect and track early FTD.
- Whole brain atrophy, dementia, and function measures show promise.
Bradley Boeve, Mayo Clinic, Rochester, Minnesota, debuted a Multidomain Impairment Rating score designed to broaden the current standard, the FTLD Clinical Dementia Rating scale, so that it accounted for the phenotypic heterogeneity of FTLD. Adam Staffaroni from University of California, San Francisco, outlined NIH EXAMINER, a composite of executive function tests that seems to detect deficits earlier in disease and even in asymptomatic individuals. Along the same vein, Howard Rosen, also from UCSF, reported how an atrophy-based dementia risk score can predict disease onset in FTD mutation carriers.

Tracking Progression.
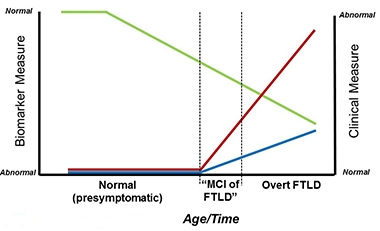
Researchers hope the MIR (blue) and MIR-SS (red) will complement biomarker measures (green) to detect the MCI phase of FTLD. [Courtesy of Bradley Boeve.]
The Multidomain Impairment Rating (MIR) scale builds both on the Clinical Dementia Rating (CDR) scale, which was devised to track clinical and functional decline in dementia patients across etiologies, and on the FTLD-CDR, which expanded the CDR to an eight-item score by adding language and behavior domains not typically affected in Alzheimer’s disease (Knopman et al., 2008). As Boeve said in his talk in Sydney, members of the ARTFL/LEFFTDS Consortium wanted to build a scale for the early phase of FTLD that is akin to the mild cognitive impairment phase of AD. This is when symptoms are so subtle that clinicians find it difficult to diagnose FTLD based on clinical tests alone. The trouble is that because the FTLD-CDR lacks visuospatial, motor, or neuropsychological components, it misses FTLD subtypes such as corticobasal syndrome, Richardson syndrome (a common form of progressive supranuclear palsy), and FTD with parkinsonism or motor neuron disease (MND).
Boeve and colleagues adapted the CDR/FTLD-CDR to encompass known functional and clinical features of FTLD. It integrates data from three sources: the patient; an informant, who is usually a spouse or immediate caregiver; and from neuropsychological tests. Like the CDR, the MIR scale ranges from zero to 3, with 3 being most impaired. The global score works like the CDR, while a summary score, the MIR-SS, works like the CDR sum of boxes to provide a more granular assessment of all sub-domains combined.
Boeve and colleagues have been testing MIR for reliability for more than a year. Researchers at Mayo Clinic and at UCSF used the scale to rate 20 ARTFL/LEFFTDS participants at each site. They comprised normal controls and those with mild cognitive and/or behavioral changes typical of the various forms of FTD, including behavioral variant, primary progressive aphasia, and FTD with parkinsonism or MND. Clinicians from both sites assessed all the volunteers and were blinded to results from the other institution. How did the results compare? Though the majority of participants were only mildly impaired, Boeve reported excellent inter-rater agreement between the two sites. Each gave 19 volunteers an MIR score of zero, 10 a score of 0.5, and six a score of 1.0 or 2.0. Overall, 35 volunteers received exactly the same score at each site. The pattern was similar for the MIR-SS. Both ratings scored a Cohen’s kappa coefficient of 0.83 for inter-rater reliability, which most statisticians consider excellent, said Boeve. Additional analyses are planned to assess the MIR.
Boeve said researchers hope to use the MIR in ALLFTD (ARTFL LEFFTDS Longitudinal Frontotemporal Lobar Degeneration).
As for longitudinal analysis, Boeve showed how the global and MIR-SS tracked with progression in two people who carried mutations in the tau gene. In both the volume of the frontotemporal lobe, as judged by MRI, had declined prior to onset of symptoms and both scales ticked up from zero at year of onset and as atrophy worsened.
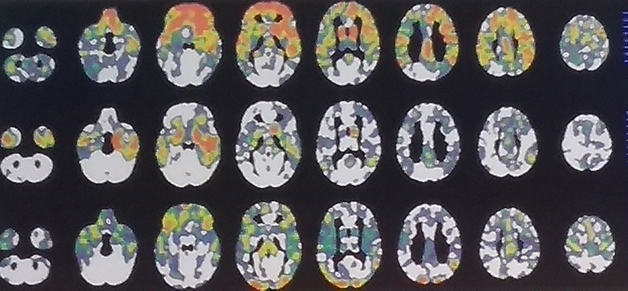
On atrophy and disease progression, Rosen emphasized the need to identify those familial FTD mutation carriers who are within two to three years of becoming symptomatic, so they can be invited into trials. “These are the people we need to study in order to demonstrate that a treatment delays onset of symptoms,” he said. He noted two major obstacles. First, age of onset varies dramatically even among people with the identical mutation. This is true for the tau gene MAPT, the progranulin gene PGRN, or in C9ORF72, which together hold the bulk of familial FTD mutations. Second, since FTD spans heterogeneous pathologies, patterns of atrophy can vary widely. “We had to recognize that different people [with the same mutation] will have symptoms because of different patterns of brain atrophy,” Rosen told Alzforum. “So we designed an analysis to be sensitive to any pattern than might lead to symptoms.” The answer, said Rosen, was to use individualized atrophy maps.

Same Cause—Different Pattern. These three C9ORF72 carriers each are at FTLD-CDR 1, yet their regional patterns of gray-matter shrinkage differ greatly. [Courtesy of Howard Rosen, UCSF.]
To generate these, Rosen quantified each volunteer’s brain volume voxel by voxel using w scores. A w score is like a composite z score but accounts for a host of other co-variables such as age, sex, total intracranial volume, and type of scanner used. The researchers counted voxels that had shrunk by more than two standard deviations compared with normal. Then they tallied those scores across brain regions for people who did, and did not, have dementia to determine how much burden, in which areas, is predictive, and used that in an overall score of total atrophy burden. This burden, regardless of brain region, might be most informative, Rosen argued.
How would this method pan out? Rosen tested it by comparing 311 reference controls with 46 people carrying familial FTD mutations in MAPT, GRN, and C9ORF72. Twenty had an FTLD-CDR score of 1 or higher, while 26 had a zero. Rosen also tested 22 FTLD-CDR 0.5 mutation carriers and 115 non-carrier relatives.
Cross-sectionally, carriers with CDR greater than 1 had a higher atrophy risk score than noncarriers or carriers with CDR zero. The atrophy burden in CDR 0.5 carriers was more variable, and no clear difference from noncarriers emerged. Longitudinally, however, Rosen found that a person’s score did predict dementia. Among 14 FTD mutation carriers who progressed from CDR zero or 0.5 over an average of 1.5 years, a participant’s odds of getting dementia increased by 1.51 for every 0.1 unit increase in atrophy risk score. Rosen calculated that an atrophy risk score of 0.5 (1.0 being the worst) was a cutoff. More than 50 percent of people with scores of 0.5 or higher had developed dementia within two years. “The nice thing about the risk score is that we developed the model based on patterns of degeneration that suggest dementia is oncoming, and then tested it in people who were observed to convert to dementia, and it did improve the ability to predict it,” Rosen said.
Rosen acknowledges that more refinement is needed using larger, independent cohorts, but believes the method could help stratify patients for recruitment into trials and for follow-up analysis. Others wondered if including white-matter changes could improve accuracy. “We certainly have room for improvement,” he agreed, “here we just tried to prove the principle.” Others noticed that mutation carriers who scored above the atrophy cutoff of 0.5 deteriorated quickly, with some being diagnosed with dementia within a year. “Are they the people we want to target in a trial, or is it too late for them to have an intervention?” one audience member asked. Rosen acknowledged that there is not enough information to answer this question. “The score is a probability estimate, so you would have to power your study based on what percentage of patients you expect to progress,” he said. “My hope is that people at that stage, with few symptoms and no problem with daily function, will benefit from drugs.”
Staffaroni and colleagues also used a composite score to estimate progression, but based it on executive function. They, too, hope the composite will circumvent the problem of heterogeneity. They used the NIH-EXAMINER, which was developed at USCF for tracking executive function in clinical trials. It includes measures of working memory, word fluency, and cognitive control, i.e., set shifting, or the ability to multitask, and has detected early cognitive changes in other neurodegenerative diseases, including Huntington’s (Possin et al., 2013; You et al., 2013). “We are looking to measure change in presymptomatic stages, something that might be used in early clinical trials. The CDR and CDR-sb are insensitive to some of the earliest changes” said Saffaroni. The scientists tested the NIH-EXAMINER in parallel with Trails B, a commonly used test of executive function.
Staffaroni recruited subjects from 18 ARTFL/LEFFTDS sites, including 93 FTLD mutation carriers evenly split among MAPT, GRN, and C9ORF72 variants, and 78 noncarriers. From each, 64 had an FTLD-CDR score of zero (69 and 83 percent, respectively), while the remainder were at 0.5. At baseline, carriers scored worse than noncarriers on EXAMINER but no different on Trails B. After one or two follow-up visits, carriers deteriorated more on the EXAMINER than did noncarriers, whereas Trails B again picked up no difference between the two.
Would the differences hold in those who were, at least as measurable currently, asymptomatic? The data suggested yes. When Staffaroni limited analysis to people who were FTLD CDR zero when they entered the study and were tested twice within 1.5 years, those with higher CDR-sb performed worse on the EXAMINER. Furthermore, decline in EXAMINER scores tracked with shrinkage of the frontal, temporal, and parietal lobes.
Staffaroni thinks the EXAMINER might be more sensitive than the CDR-sb, and better suited as a clinical measure for early stage FTD, though he agreed this needs more testing. He also plans to compare if its composite or sub-domain scores work better, and study both in people with specific mutations. “Our sample set included people with mutations in C9ORF72, MAPT, and progranulin, but trials will likely target carriers of a single gene,” he said.—Tom Fagan
References
News Citations
Paper Citations
- Knopman DS, Kramer JH, Boeve BF, Caselli RJ, Graff-Radford NR, Mendez MF, Miller BL, Mercaldo N. Development of methodology for conducting clinical trials in frontotemporal lobar degeneration. Brain. 2008 Nov;131(Pt 11):2957-68. PubMed.
- Possin KL, Feigenbaum D, Rankin KP, Smith GE, Boxer AL, Wood K, Hanna SM, Miller BL, Kramer JH. Dissociable executive functions in behavioral variant frontotemporal and Alzheimer dementias. Neurology. 2013 Jun 11;80(24):2180-5. PubMed.
- You SC, Geschwind MD, Sha SJ, Apple A, Satris G, Wood KA, Johnson ET, Gooblar J, Feuerstein JS, Finkbeiner S, Kang GA, Miller BL, Hess CP, Kramer JH, Possin KL. Executive functions in premanifest Huntington's disease. Mov Disord. 2013 Dec 27; PubMed.
External Citations
Further Reading
No Available Further Reading
Annotate
To make an annotation you must Login or Register.

Comments
No Available Comments
Make a Comment
To make a comment you must login or register.