Polygenic Scores Paint Microglia as Culprits in Alzheimer's
Quick Links
Mere responders no more, microglia nowadays are respected—if not feared—as early actors when a person is developing a neurodegenerative disease. Several presentations at last month’s Alzheimer’s Association International Conference underscored their pre-eminent role within the pathogenetic cascade of Alzheimer’s disease. Using a cell-type-specific version of a polygenic risk score, researchers reported that myriad genetic variations that are active in microglia can exacerbate amyloid deposition. In contrast, AD-related polygenic variation that is active in neurons has more impact on cognition. To chart how genetic variation alters the expression of microglial genes and influences AD and related diseases, scientists introduced the microglial genomic atlas (MiGA), the largest repository of human microglial transcriptomes to date. The atlas helped nail down associations between AD risk variants and microglial genes, which previously had been inferred from studies of other myeloid cell types.
- Cell-type-specific polygenic risk scores implicate microglial genes in amyloid deposition.
- The microglia genomic atlas—MiGA—clarifies how risk variants influence expression of microglial genes.
- Neuron-specific polygenic scores associate with cognition.
Massive genome-wide association studies have uncovered dozens of genetic polymorphisms that influence the risk of Alzheimer’s disease (Feb 2021 news). Most of these individual variants impart only a smidgen of risk, but collectively, they exert a strong influence. Polygenic risk scores are calculated by tallying the effects of multiple risk variants. They have been tied to all manner of AD-related phenotypes, including plaques, tangles, brain atrophy, and cognitive decline (Escott-Price et al., 2015; Jul 2016 news; Feb 2019 news).
Lost in this polygenic fray is the question of exactly which cells these cumulative risk variants influence. After all, most, if not all, AD risk variants regulate expression in specific cell types. This was the main theme of Hyun-Sik Yang, Brigham and Women’s Hospital in Boston. Wondering how genetic variants active in different cell types contribute to different aspects of preclinical AD, Yang accessed baseline data from the A4 study, a secondary prevention trial that is testing solanezumab in people with brain amyloid who were cognitively normal at baseline. All 2,961 A4 participants had consented to genome-wide genotyping.
Yang and colleagues started by calculating an overall polygenic risk score for each participant based on the variants he or she carried. Using risk variants identified in the largest AD GWAS to date, the researchers employed a Bayesian statistical method that accounts for individual variations in genomic architecture to calculate each person’s PRS (Ge et al., 2019). The analysis incorporated contributions from thousands of genetic variants, most of which fell below a stringent threshold for genome-wide significance.
Crucially, for each variant the scientists referenced single-cell RNA sequencing data from postmortem brain samples in order to designate which cell types expressed the putative causal gene (Mathys et al., 2019). This enabled them to derive distinct polygenic risk scores for each of eight different cell types: excitatory neurons, inhibitory neurons, oligodendrocytes, oligodendrocyte progenitors, astrocytes, microglia, endothelial cells, and pericytes. Some genetic variants were active in more than one cell type. Ultimately, each A4 participant was assigned nine different PRSs: an overall one that included all variants, and one for each of the eight cell types.
Which PRS had the strongest ties to baseline amyloid levels among all the A4 participants? The microglial score was the clear winner in this regard, Yang said. Its association with baseline Aβ load was about twice as strong as either neuronal PRS, and topped the overall PRS by a third. This finding cast microglia as intimately involved in amyloid.

Microglia Drive Plaque. Among people in the A4 study, their microglia-specific PRS scores had the strongest association (y axis) with baseline amyloid burden. [Courtesy of Hyun-Sik Yang, Brigham and Women’s Hospital.]
The story was different for cognition. Using participants’ baseline scores on the preclinical AD cognitive composite (PACC) as a gauge, Yang found that more than any other PRS, a person’s excitatory neuron PRS was most strongly tied to his or her cognitive performance at study start. The higher a person’s excitatory neuron PRS, i.e., the more risk variants known to affect genes in these neurons, the lower he or she tended to perform on the test. The strength of this relationship dropped only slightly when adjusted for Aβ burden, suggesting that cumulative AD risk variants active in excitatory neurons influence cognition independently of amyloid. Yang thinks these variants could influence AD risk by weakening neuronal function. Akin to the concept of cognitive reserve, a high neuronal PRS could render neurons more susceptible to a given amount of amyloid.
Julie Williams of Cardiff University in Wales commented that Yang’s findings convincingly show that microglia are part of the causative pathway of AD, especially since A4 participants were at the earliest stages of the disease.
Lianne Reus of Amsterdam University Medical Center also took a polygenic approach to investigate how different cell types influence AD pathogenesis. At AAIC, Reus linked cell-type-specific PRS to fluid biomarkers. She drew genotyping data from more than 617 participants in the Alzheimer’s Disease Neuroimaging Initiative (ADNI) and 918 from the European Medical Information Framework for Alzheimer’s Disease (EMIF-AD) for a total of 525 controls, 709 people with MCI, and 272 with AD. (Shaw et al., 2009; Bos et al., 2018).
To calculate cell-type-specific PRSs for each person, Reus took a more candidate-based approach. Instead of weaving thousands of variants into her analysis, Reus selected only 26. These had risen to genome-wide significance in GWAS, and had detectable levels of RNA in at least one brain-cell type in the BRAIN-RNA-Seq database (de Rojas et al., 2021; Zhang et al., 2014). Reus designated a gene as cell-type specific if at least 50 percent of its expression came from a single cell type. Of the 26 variants, 10 were nonspecific, 11 were microglia-specific, four were astrocyte-specific, one was specific to neurons, and none were specific for endothelial cells or oligodendrocytes (see genes in image below). With this minimalist panel, Reus calculated four PRSs for each person: one for the 10 nonspecific loci, and one each for microglia, astrocytes, and even neurons, though this was based on only one variant. She then asked how each person’s four PRSs associated with their CSF concentration of Aβ, total tau, p-tau181, neurogranin, neurofilament light (NfL), and YKL40.
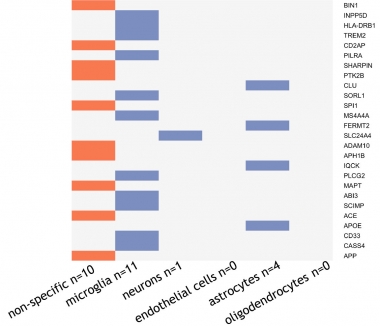
Getting Specific. Of 26 AD risk variants (right), 10 were expressed across cell types, 11 were more expressed in microglia, four in astrocytes, and one was found expressed only in neurons. [Courtesy of Lianne Reus, Amsterdam University.]
ApoE was designated as an astrocyte-specific gene. When included in the PRS for that cell type, the astrocyte polygenic scores strongly associated with CSF Aβ, total tau, p-tau181, and neurogranin. Without ApoE, a person’s astrocyte PRS, based on only three possible variants, associated only with CSF Aβ, demonstrating the power of ApoE’s connection to AD pathogenesis more broadly. The microglial PRS also associated with CSF Aβ, and nominally with total tau. Neither the neuron-specific score nor the nonspecific PRS was significantly tied to any CSF biomarker. Notably, only one variant in SLC24A4 was part of the neuronal “PRS” in this dataset.
Although Yang and Reus’s studies employed different methods to calculate PRS and to designate cell-type specificity of AD risk variants, they drew one common conclusion, namely that markers of amyloid deposition associate with variants expressed in astrocytes and/or microglia.

Glial Ties to Aβ. The astrocyte PRS linked to several CSF biomarkers (right) with high statistical significance. Without ApoE, the astrocyte PRS only linked to CSF Aβ. Microglial PRS associated with CSF Aβ and nominally with total tau. [Courtesy of Lianne Reus, Amsterdam University.]
“Cell-type-specific polygenic risk scores help to clarify the contribution of specific cell types in AD pathophysiology in different stages of the disease,” wrote Betty Tijms of Amsterdam University Medical Center and Pieter-Jelle Visser of Maastricht University in the Netherlands, who co-authored the study with Reus. “The precise cell-type-dependent interactions will probably vary between individuals, and so this approach may help to better understand interindividual variation in disease manifestation.”
Microglia Atlas Connects the Dots
While the central role of microglial variants in AD has become clear, exactly how most of them influence microglial gene expression and cellular function is unclear. That is partly because microglia are so changeable. They adapt quickly to changes in their environment. Genetic variation could therefore affect microglia differently depending on which brain region they are in, their age, or their response to a pathological condition. What’s more, because genetic variants rarely occur within the coding region of a gene, and gene expression varies dramatically by cell type, detailed transcriptomic data are needed to nail down microglia-specific relationships between variants and gene expression. This requires large numbers of human microglial samples. These are in short supply, hence researchers have used transcriptomic data from other myeloid cells, or they have made do with live microglia extracted from small numbers of people during brain surgery to chart connections between genetic variants and gene expression in the cells (Aug 2019 news; Jun 2017 news; Nov 2019 news).

Mega MiGA? Transcriptomes of 255 live microglial samples, taken from 100 human donors at autopsy, form expression profiles from four brain regions. MiGA could serve a number of purposes, including prioritization of disease genes. [Courtesy of Lopes et al., bioRxiv, 2021.]
At AAIC, Katia Lopes of the Icahn School of Medicine in New York presented initial findings of transcriptomes garnered from one of the larger brain samples to date. Called the microglia genomic atlas (MiGA), the trove was built using 255 tissue samples taken from 100 human donors at autopsy. The donors included people with no signs of neurological disease, as well as those with AD, PD, and other neurological disorders. Live microglia were teased from brain samples collected from four brain regions: the medial frontal gyrus and superior temporal gyrus in the cortex, and the thalamus and subventricular zone. Researchers led by Robin Franklin at the University of Cambridge and Daniel Gaffney at the Wellcome Sanger Institute, Hinxton, both in the U.K., recently profiled transcriptomes of live microglial among 112 tissue samples acquired from 141 donors undergoing neurosurgery (Young et al., 2021).
Sex did not significantly alter microglial profiles, but age did: The researchers detected nearly 1,700 genes whose expression in these cells changes with age. Genes upregulated in aging included those involved in lipid metabolism and immune responses, while those that flagged with age play a role in cell motility, polarity, and IL-6 cytokine signaling. Intriguingly, some of the genes that lessen with age overlapped with those reported to dampen microglia expression in people who have AD (Srinivasan et al., 2020).
At AAIC, Lopes showed results from a quantitative trait loci (QTL) analysis. Essentially, the scientists looked for genetic polymorphisms that influenced either the expression or splicing of genes in microglia. The eQTLs modulate expression of genes that are dubbed eGenes; sQTLs influence splicing of sGenes. By combining microglial transcriptome data from all four brain regions sampled, the researchers identified 3,611 eGenes and 4,614 sGenes. Most of these were expressed across brain regions, but some were specific. For example, expression of the RNF40 gene was influenced by one eQTL, but only in microglia inhabiting the subventricular zone.
Did any of the eQTLs or sQTLs identified in MiGA influence genes associated with AD risk loci? Indeed, the researchers found 15 MiGA QTLs that influenced expression and/or splicing of genes associated with 10 AD risk loci, meaning that some loci had more than one QTL. When more than one gene associates with a given risk locus, researchers cannot always tell which gene is driving the risk. Lopes and colleagues leveraged the co-localization of QTLs with risk loci to help answer this question.
Indeed, for one such AD risk locus—ECHDC3—Lopes used data from MiGA to zero in on the gene influenced by the variation. The lead AD risk SNP resides between two genes in the locus: ECHDC3 and USP6NL. In MiGA, Lopes identified an eQTL within the locus that associated with increased expression of USP6NL, and was also nominally tied to increased AD risk.
Using fine mapping of the locus, she found three additional SNPs associated with higher AD risk. Considering the AD risk of SNPs and eQTL SNP combined, four of the five landed within a microglial enhancer. Finally, using published microglial proximity ligation assisted ChIP-Seq (PLAC-Seq) data, which essentially catches an enhancer in the act of hooking up with a gene, Lopes found that the enhancer associated with USP6NL, but not ECHDC3 (Nott et al., 2019).
In short, three different forms of data converged on USP6NL as the causal gene. “Now that we have all this information—eQTL, co-localization with risk SNPs, and PLAC-Seq—it is exciting to overlay all of these to find the mechanism behind the altered expression,” Lopes said.
MiGA demonstrated that many neurological disease susceptibility loci are mediated through gene expression or splicing in microglia, and suggested causal variants, noted Valentina Escott-Price of Cardiff University. The atlas may therefore help further refine gene and SNP lists to make the polygenic risk scores—which rely on estimations of causal genes—more relevant to the disease and improve prediction for eventual use in people.—Jessica Shugart
References
News Citations
- Massive GWAS Meta-Analysis Digs Up Trove of Alzheimer’s Genes
- Are Early Harbingers of Alzheimer’s Scattered Across the Genome?
- Multi-Gene Score Predicts Cognitive Decline Independently of Brain Imaging
- AD Genetic Risk Tied to Changes in Microglial Gene Expression
- What Makes a Microglia? Tales from the Transcriptome
- Cell-Specific Enhancer Atlas Centers AD Risk in Microglia. Again.
Paper Citations
- Escott-Price V, Sims R, Bannister C, Harold D, Vronskaya M, Majounie E, Badarinarayan N, GERAD/PERADES, IGAP consortia, Morgan K, Passmore P, Holmes C, Powell J, Brayne C, Gill M, Mead S, Goate A, Cruchaga C, Lambert JC, van Duijn C, Maier W, Ramirez A, Holmans P, Jones L, Hardy J, Seshadri S, Schellenberg GD, Amouyel P, Williams J. Common polygenic variation enhances risk prediction for Alzheimer's disease. Brain. 2015 Dec;138(Pt 12):3673-84. Epub 2015 Oct 21 PubMed.
- Ge T, Chen CY, Ni Y, Feng YA, Smoller JW. Polygenic prediction via Bayesian regression and continuous shrinkage priors. Nat Commun. 2019 Apr 16;10(1):1776. PubMed.
- Mathys H, Davila-Velderrain J, Peng Z, Gao F, Mohammadi S, Young JZ, Menon M, He L, Abdurrob F, Jiang X, Martorell AJ, Ransohoff RM, Hafler BP, Bennett DA, Kellis M, Tsai LH. Single-cell transcriptomic analysis of Alzheimer's disease. Nature. 2019 Jun;570(7761):332-337. Epub 2019 May 1 PubMed.
- Shaw LM, Vanderstichele H, Knapik-Czajka M, Clark CM, Aisen PS, Petersen RC, Blennow K, Soares H, Simon A, Lewczuk P, Dean R, Siemers E, Potter W, Lee VM, Trojanowski JQ, Alzheimer's Disease Neuroimaging Initiative. Cerebrospinal fluid biomarker signature in Alzheimer's disease neuroimaging initiative subjects. Ann Neurol. 2009 Apr;65(4):403-13. PubMed.
- Bos I, Vos S, Vandenberghe R, Scheltens P, Engelborghs S, Frisoni G, Molinuevo JL, Wallin A, Lleó A, Popp J, Martinez-Lage P, Baird A, Dobson R, Legido-Quigley C, Sleegers K, Van Broeckhoven C, Bertram L, Ten Kate M, Barkhof F, Zetterberg H, Lovestone S, Streffer J, Visser PJ. The EMIF-AD Multimodal Biomarker Discovery study: design, methods and cohort characteristics. Alzheimers Res Ther. 2018 Jul 6;10(1):64. PubMed.
- de Rojas I, Moreno-Grau S, Tesi N, Grenier-Boley B, Andrade V, Jansen IE, Pedersen NL, Stringa N, Zettergren A, Hernández I, Montrreal L, Antúnez C, Antonell A, Tankard RM, Bis JC, Sims R, Bellenguez C, Quintela I, González-Perez A, Calero M, Franco-Macías E, Macías J, Blesa R, Cervera-Carles L, Menéndez-González M, Frank-García A, Royo JL, Moreno F, Huerto Vilas R, Baquero M, Diez-Fairen M, Lage C, García-Madrona S, García-González P, Alarcón-Martín E, Valero S, Sotolongo-Grau O, Ullgren A, Naj AC, Lemstra AW, Benaque A, Pérez-Cordón A, Benussi A, Rábano A, Padovani A, Squassina A, de Mendonça A, Arias Pastor A, Kok AA, Meggy A, Pastor AB, Espinosa A, Corma-Gómez A, Martín Montes A, Sanabria Á, DeStefano AL, Schneider A, Haapasalo A, Kinhult Ståhlbom A, Tybjærg-Hansen A, Hartmann AM, Spottke A, Corbatón-Anchuelo A, Rongve A, Borroni B, Arosio B, Nacmias B, Nordestgaard BG, Kunkle BW, Charbonnier C, Abdelnour C, Masullo C, Martínez Rodríguez C, Muñoz-Fernandez C, Dufouil C, Graff C, Ferreira CB, Chillotti C, Reynolds CA, Fenoglio C, Van Broeckhoven C, Clark C, Pisanu C, Satizabal CL, Holmes C, Buiza-Rueda D, Aarsland D, Rujescu D, Alcolea D, Galimberti D, Wallon D, Seripa D, Grünblatt E, Dardiotis E, Düzel E, Scarpini E, Conti E, Rubino E, Gelpi E, Rodriguez-Rodriguez E, Duron E, Boerwinkle E, Ferri E, Tagliavini F, Küçükali F, Pasquier F, Sanchez-Garcia F, Mangialasche F, Jessen F, Nicolas G, Selbæk G, Ortega G, Chêne G, Hadjigeorgiou G, Rossi G, Spalletta G, Giaccone G, Grande G, Binetti G, Papenberg G, Hampel H, Bailly H, Zetterberg H, Soininen H, Karlsson IK, Alvarez I, Appollonio I, Giegling I, Skoog I, Saltvedt I, Rainero I, Rosas Allende I, Hort J, Diehl-Schmid J, Van Dongen J, Vidal JS, Lehtisalo J, Wiltfang J, Thomassen JQ, Kornhuber J, Haines JL, Vogelgsang J, Pineda JA, Fortea J, Popp J, Deckert J, Buerger K, Morgan K, Fließbach K, Sleegers K, Molina-Porcel L, Kilander L, Weinhold L, Farrer LA, Wang LS, Kleineidam L, Farotti L, Parnetti L, Tremolizzo L, Hausner L, Benussi L, Froelich L, Ikram MA, Deniz-Naranjo MC, Tsolaki M, Rosende-Roca M, Löwenmark M, Hulsman M, Spallazzi M, Pericak-Vance MA, Esiri M, Bernal Sánchez-Arjona M, Dalmasso MC, Martínez-Larrad MT, Arcaro M, Nöthen MM, Fernández-Fuertes M, Dichgans M, Ingelsson M, Herrmann MJ, Scherer M, Vyhnalek M, Kosmidis MH, Yannakoulia M, Schmid M, Ewers M, Heneka MT, Wagner M, Scamosci M, Kivipelto M, Hiltunen M, Zulaica M, Alegret M, Fornage M, Roberto N, van Schoor NM, Seidu NM, Banaj N, Armstrong NJ, Scarmeas N, Scherbaum N, Goldhardt O, Hanon O, Peters O, Skrobot OA, Quenez O, Lerch O, Bossù P, Caffarra P, Dionigi Rossi P, Sakka P, Hoffmann P, Holmans PA, Fischer P, Riederer P, Yang Q, Marshall R, Kalaria RN, Mayeux R, Vandenberghe R, Cecchetti R, Ghidoni R, Frikke-Schmidt R, Sorbi S, Hägg S, Engelborghs S, Helisalmi S, Botne Sando S, Kern S, Archetti S, Boschi S, Fostinelli S, Gil S, Mendoza S, Mead S, Ciccone S, Djurovic S, Heilmann-Heimbach S, Riedel-Heller S, Kuulasmaa T, Del Ser T, Lebouvier T, Polak T, Ngandu T, Grimmer T, Bessi V, Escott-Price V, Giedraitis V, Deramecourt V, Maier W, Jian X, Pijnenburg YA, EADB contributors, GR@ACE study group, DEGESCO consortium, IGAP (ADGC, CHARGE, EADI, GERAD), PGC-ALZ consortia, Kehoe PG, Garcia-Ribas G, Sánchez-Juan P, Pastor P, Pérez-Tur J, Piñol-Ripoll G, Lopez de Munain A, García-Alberca JM, Bullido MJ, Álvarez V, Lleó A, Real LM, Mir P, Medina M, Scheltens P, Holstege H, Marquié M, Sáez ME, Carracedo Á, Amouyel P, Schellenberg GD, Williams J, Seshadri S, van Duijn CM, Mather KA, Sánchez-Valle R, Serrano-Ríos M, Orellana A, Tárraga L, Blennow K, Huisman M, Andreassen OA, Posthuma D, Clarimón J, Boada M, van der Flier WM, Ramirez A, Lambert JC, van der Lee SJ, Ruiz A. Common variants in Alzheimer's disease and risk stratification by polygenic risk scores. Nat Commun. 2021 Jun 7;12(1):3417. PubMed. Correction.
- Zhang Y, Chen K, Sloan SA, Bennett ML, Scholze AR, O'Keeffe S, Phatnani HP, Guarnieri P, Caneda C, Ruderisch N, Deng S, Liddelow SA, Zhang C, Daneman R, Maniatis T, Barres BA, Wu JQ. An RNA-sequencing transcriptome and splicing database of glia, neurons, and vascular cells of the cerebral cortex. J Neurosci. 2014 Sep 3;34(36):11929-47. PubMed.
- Young AM, Kumasaka N, Calvert F, Hammond TR, Knights A, Panousis N, Park JS, Schwartzentruber J, Liu J, Kundu K, Segel M, Murphy NA, McMurran CE, Bulstrode H, Correia J, Budohoski KP, Joannides A, Guilfoyle MR, Trivedi R, Kirollos R, Morris R, Garnett MR, Timofeev I, Jalloh I, Holland K, Mannion R, Mair R, Watts C, Price SJ, Kirkpatrick PJ, Santarius T, Mountjoy E, Ghoussaini M, Soranzo N, Bayraktar OA, Stevens B, Hutchinson PJ, Franklin RJ, Gaffney DJ. A map of transcriptional heterogeneity and regulatory variation in human microglia. Nat Genet. 2021 Jun;53(6):861-868. Epub 2021 Jun 3 PubMed.
- Srinivasan K, Friedman BA, Etxeberria A, Huntley MA, van der Brug MP, Foreman O, Paw JS, Modrusan Z, Beach TG, Serrano GE, Hansen DV. Alzheimer's Patient Microglia Exhibit Enhanced Aging and Unique Transcriptional Activation. Cell Rep. 2020 Jun 30;31(13):107843. PubMed.
- Nott A, Holtman IR, Coufal NG, Schlachetzki JC, Yu M, Hu R, Han CZ, Pena M, Xiao J, Wu Y, Keulen Z, Pasillas MP, O'Connor C, Nickl CK, Schafer ST, Shen Z, Rissman RA, Brewer JB, Gosselin D, Gonda DD, Levy ML, Rosenfeld MG, McVicker G, Gage FH, Ren B, Glass CK. Brain cell type-specific enhancer-promoter interactome maps and disease-risk association. Science. 2019 Nov 29;366(6469):1134-1139. Epub 2019 Nov 14 PubMed.
Further Reading
Primary Papers
- de Paiva Lopes K, Snijders GJ, Humphrey J, Allan A, Sneeboer M, Navarro A, Schilder BM, Vialle RA, Parks M, Missall R, van Zuiden W, Gigase F, Kübler F, van Berlekom AB, Böttcher C, Priller J, Kahn RS, de Witte L, Raj T. Atlas of genetic effects in human microglia transcriptome across brain regions, aging and disease pathologies. BioRxiv, October 28, 2020 bioRxiv.
Annotate
To make an annotation you must Login or Register.
Comments
Cardiff University
The Polygenic Risk Score (PRS), capturing AD risk across the whole genome, does not work uniformly well in all datasets. For example, we have shown in our earlier work that SNPs with AD association at p<0.5, and recently at 0.1, improve AD risk prediction over and above the genome-wide significant/suggestive SNPs (Escott-Price et al., 2017; Leonenko et al., 2021). Others have shown best p-value thresholds for SNP selection to be p<5x10⁻⁸, or p<1x10⁻⁵ (de Rojas et al., 2021; Zang et al., 2020). These differences could be explained by the specifics of the datasets, including age of the participants, clinical or pathological assessments of cases and/or controls, etc.
There is a need in the field to understand these differences. Dissection of the AD risk by genes involved in different mechanisms of disease development and progression could help. One way forward is to look at the biological pathways suggested by GWAS studies (e.g., Kunkle et al., 2019). However, the definition of disease pathways is based mostly on the different functional categories defined by, for example, gene ontology. This can be noisy because there is little expert scrutiny, inclusion thresholds are low, and almost all AD genes are implicated in more than one pathway (Koopmans et al., 2019). Our analyses also show low predictability by PRS limited to these gene sets (Bellou et al., 2020).
At AAIC there were a number of presentations, including by Hyun-Sik Yang and Lianne Reus, suggesting that refining the PRS by genes expressed in relevant tissues, for example microglia or neuron-specific genes, may lead to improved prediction of a particular aspect of the disease. The work of Katia Lopes introducing the microglia genomic atlas, showing that many neurological disease susceptibility loci are mediated through gene expression or splicing in microglia, and suggesting causal variants, may help to further refine gene and SNP lists to make the PRS even more relevant to the disease and therefore improve prediction.
References:
Escott-Price V, Myers AJ, Huentelman M, Hardy J. Polygenic risk score analysis of pathologically confirmed Alzheimer disease. Ann Neurol. 2017 Aug;82(2):311-314. Epub 2017 Aug 9 PubMed.
Leonenko G, Baker E, Stevenson-Hoare J, Sierksma A, Fiers M, Williams J, de Strooper B, Escott-Price V. Identifying individuals with high risk of Alzheimer's disease using polygenic risk scores. Nat Commun. 2021 Jul 23;12(1):4506. PubMed.
de Rojas I, Moreno-Grau S, Tesi N, Grenier-Boley B, Andrade V, Jansen IE, Pedersen NL, Stringa N, Zettergren A, Hernández I, Montrreal L, Antúnez C, Antonell A, Tankard RM, Bis JC, Sims R, Bellenguez C, Quintela I, González-Perez A, Calero M, Franco-Macías E, Macías J, Blesa R, Cervera-Carles L, Menéndez-González M, Frank-García A, Royo JL, Moreno F, Huerto Vilas R, Baquero M, Diez-Fairen M, Lage C, García-Madrona S, García-González P, Alarcón-Martín E, Valero S, Sotolongo-Grau O, Ullgren A, Naj AC, Lemstra AW, Benaque A, Pérez-Cordón A, Benussi A, Rábano A, Padovani A, Squassina A, de Mendonça A, Arias Pastor A, Kok AA, Meggy A, Pastor AB, Espinosa A, Corma-Gómez A, Martín Montes A, Sanabria Á, DeStefano AL, Schneider A, Haapasalo A, Kinhult Ståhlbom A, Tybjærg-Hansen A, Hartmann AM, Spottke A, Corbatón-Anchuelo A, Rongve A, Borroni B, Arosio B, Nacmias B, Nordestgaard BG, Kunkle BW, Charbonnier C, Abdelnour C, Masullo C, Martínez Rodríguez C, Muñoz-Fernandez C, Dufouil C, Graff C, Ferreira CB, Chillotti C, Reynolds CA, Fenoglio C, Van Broeckhoven C, Clark C, Pisanu C, Satizabal CL, Holmes C, Buiza-Rueda D, Aarsland D, Rujescu D, Alcolea D, Galimberti D, Wallon D, Seripa D, Grünblatt E, Dardiotis E, Düzel E, Scarpini E, Conti E, Rubino E, Gelpi E, Rodriguez-Rodriguez E, Duron E, Boerwinkle E, Ferri E, Tagliavini F, Küçükali F, Pasquier F, Sanchez-Garcia F, Mangialasche F, Jessen F, Nicolas G, Selbæk G, Ortega G, Chêne G, Hadjigeorgiou G, Rossi G, Spalletta G, Giaccone G, Grande G, Binetti G, Papenberg G, Hampel H, Bailly H, Zetterberg H, Soininen H, Karlsson IK, Alvarez I, Appollonio I, Giegling I, Skoog I, Saltvedt I, Rainero I, Rosas Allende I, Hort J, Diehl-Schmid J, Van Dongen J, Vidal JS, Lehtisalo J, Wiltfang J, Thomassen JQ, Kornhuber J, Haines JL, Vogelgsang J, Pineda JA, Fortea J, Popp J, Deckert J, Buerger K, Morgan K, Fließbach K, Sleegers K, Molina-Porcel L, Kilander L, Weinhold L, Farrer LA, Wang LS, Kleineidam L, Farotti L, Parnetti L, Tremolizzo L, Hausner L, Benussi L, Froelich L, Ikram MA, Deniz-Naranjo MC, Tsolaki M, Rosende-Roca M, Löwenmark M, Hulsman M, Spallazzi M, Pericak-Vance MA, Esiri M, Bernal Sánchez-Arjona M, Dalmasso MC, Martínez-Larrad MT, Arcaro M, Nöthen MM, Fernández-Fuertes M, Dichgans M, Ingelsson M, Herrmann MJ, Scherer M, Vyhnalek M, Kosmidis MH, Yannakoulia M, Schmid M, Ewers M, Heneka MT, Wagner M, Scamosci M, Kivipelto M, Hiltunen M, Zulaica M, Alegret M, Fornage M, Roberto N, van Schoor NM, Seidu NM, Banaj N, Armstrong NJ, Scarmeas N, Scherbaum N, Goldhardt O, Hanon O, Peters O, Skrobot OA, Quenez O, Lerch O, Bossù P, Caffarra P, Dionigi Rossi P, Sakka P, Hoffmann P, Holmans PA, Fischer P, Riederer P, Yang Q, Marshall R, Kalaria RN, Mayeux R, Vandenberghe R, Cecchetti R, Ghidoni R, Frikke-Schmidt R, Sorbi S, Hägg S, Engelborghs S, Helisalmi S, Botne Sando S, Kern S, Archetti S, Boschi S, Fostinelli S, Gil S, Mendoza S, Mead S, Ciccone S, Djurovic S, Heilmann-Heimbach S, Riedel-Heller S, Kuulasmaa T, Del Ser T, Lebouvier T, Polak T, Ngandu T, Grimmer T, Bessi V, Escott-Price V, Giedraitis V, Deramecourt V, Maier W, Jian X, Pijnenburg YA, EADB contributors, GR@ACE study group, DEGESCO consortium, IGAP (ADGC, CHARGE, EADI, GERAD), PGC-ALZ consortia, Kehoe PG, Garcia-Ribas G, Sánchez-Juan P, Pastor P, Pérez-Tur J, Piñol-Ripoll G, Lopez de Munain A, García-Alberca JM, Bullido MJ, Álvarez V, Lleó A, Real LM, Mir P, Medina M, Scheltens P, Holstege H, Marquié M, Sáez ME, Carracedo Á, Amouyel P, Schellenberg GD, Williams J, Seshadri S, van Duijn CM, Mather KA, Sánchez-Valle R, Serrano-Ríos M, Orellana A, Tárraga L, Blennow K, Huisman M, Andreassen OA, Posthuma D, Clarimón J, Boada M, van der Flier WM, Ramirez A, Lambert JC, van der Lee SJ, Ruiz A. Common variants in Alzheimer's disease and risk stratification by polygenic risk scores. Nat Commun. 2021 Jun 7;12(1):3417. PubMed. Correction.
Zhang Q, Sidorenko J, Couvy-Duchesne B, Marioni RE, Wright MJ, Goate AM, Marcora E, Huang KL, Porter T, Laws SM, Australian Imaging Biomarkers and Lifestyle (AIBL) Study, Sachdev PS, Mather KA, Armstrong NJ, Thalamuthu A, Brodaty H, Yengo L, Yang J, Wray NR, McRae AF, Visscher PM. Risk prediction of late-onset Alzheimer's disease implies an oligogenic architecture. Nat Commun. 2020 Sep 23;11(1):4799. PubMed.
Kunkle BW, Grenier-Boley B, Sims R, Bis JC, Damotte V, Naj AC, Boland A, Vronskaya M, van der Lee SJ, Amlie-Wolf A, Bellenguez C, Frizatti A, Chouraki V, Martin ER, Sleegers K, Badarinarayan N, Jakobsdottir J, Hamilton-Nelson KL, Moreno-Grau S, Olaso R, Raybould R, Chen Y, Kuzma AB, Hiltunen M, Morgan T, Ahmad S, Vardarajan BN, Epelbaum J, Hoffmann P, Boada M, Beecham GW, Garnier JG, Harold D, Fitzpatrick AL, Valladares O, Moutet ML, Gerrish A, Smith AV, Qu L, Bacq D, Denning N, Jian X, Zhao Y, Del Zompo M, Fox NC, Choi SH, Mateo I, Hughes JT, Adams HH, Malamon J, Sanchez-Garcia F, Patel Y, Brody JA, Dombroski BA, Naranjo MC, Daniilidou M, Eiriksdottir G, Mukherjee S, Wallon D, Uphill J, Aspelund T, Cantwell LB, Garzia F, Galimberti D, Hofer E, Butkiewicz M, Fin B, Scarpini E, Sarnowski C, Bush WS, Meslage S, Kornhuber J, White CC, Song Y, Barber RC, Engelborghs S, Sordon S, Voijnovic D, Adams PM, Vandenberghe R, Mayhaus M, Cupples LA, Albert MS, De Deyn PP, Gu W, Himali JJ, Beekly D, Squassina A, Hartmann AM, Orellana A, Blacker D, Rodriguez-Rodriguez E, Lovestone S, Garcia ME, Doody RS, Munoz-Fernadez C, Sussams R, Lin H, Fairchild TJ, Benito YA, Holmes C, Karamujić-Čomić H, Frosch MP, Thonberg H, Maier W, Roshchupkin G, Ghetti B, Giedraitis V, Kawalia A, Li S, Huebinger RM, Kilander L, Moebus S, Hernández I, Kamboh MI, Brundin R, Turton J, Yang Q, Katz MJ, Concari L, Lord J, Beiser AS, Keene CD, Helisalmi S, Kloszewska I, Kukull WA, Koivisto AM, Lynch A, Tarraga L, Larson EB, Haapasalo A, Lawlor B, Mosley TH, Lipton RB, Solfrizzi V, Gill M, Longstreth WT Jr, Montine TJ, Frisardi V, Diez-Fairen M, Rivadeneira F, Petersen RC, Deramecourt V, Alvarez I, Salani F, Ciaramella A, Boerwinkle E, Reiman EM, Fievet N, Rotter JI, Reisch JS, Hanon O, Cupidi C, Andre Uitterlinden AG, Royall DR, Dufouil C, Maletta RG, de Rojas I, Sano M, Brice A, Cecchetti R, George-Hyslop PS, Ritchie K, Tsolaki M, Tsuang DW, Dubois B, Craig D, Wu CK, Soininen H, Avramidou D, Albin RL, Fratiglioni L, Germanou A, Apostolova LG, Keller L, Koutroumani M, Arnold SE, Panza F, Gkatzima O, Asthana S, Hannequin D, Whitehead P, Atwood CS, Caffarra P, Hampel H, Quintela I, Carracedo Á, Lannfelt L, Rubinsztein DC, Barnes LL, Pasquier F, Frölich L, Barral S, McGuinness B, Beach TG, Johnston JA, Becker JT, Passmore P, Bigio EH, Schott JM, Bird TD, Warren JD, Boeve BF, Lupton MK, Bowen JD, Proitsi P, Boxer A, Powell JF, Burke JR, Kauwe JS, Burns JM, Mancuso M, Buxbaum JD, Bonuccelli U, Cairns NJ, McQuillin A, Cao C, Livingston G, Carlson CS, Bass NJ, Carlsson CM, Hardy J, Carney RM, Bras J, Carrasquillo MM, Guerreiro R, Allen M, Chui HC, Fisher E, Masullo C, Crocco EA, DeCarli C, Bisceglio G, Dick M, Ma L, Duara R, Graff-Radford NR, Evans DA, Hodges A, Faber KM, Scherer M, Fallon KB, Riemenschneider M, Fardo DW, Heun R, Farlow MR, Kölsch H, Ferris S, Leber M, Foroud TM, Heuser I, Galasko DR, Giegling I, Gearing M, Hüll M, Geschwind DH, Gilbert JR, Morris J, Green RC, Mayo K, Growdon JH, Feulner T, Hamilton RL, Harrell LE, Drichel D, Honig LS, Cushion TD, Huentelman MJ, Hollingworth P, Hulette CM, Hyman BT, Marshall R, Jarvik GP, Meggy A, Abner E, Menzies GE, Jin LW, Leonenko G, Real LM, Jun GR, Baldwin CT, Grozeva D, Karydas A, Russo G, Kaye JA, Kim R, Jessen F, Kowall NW, Vellas B, Kramer JH, Vardy E, LaFerla FM, Jöckel KH, Lah JJ, Dichgans M, Leverenz JB, Mann D, Levey AI, Pickering-Brown S, Lieberman AP, Klopp N, Lunetta KL, Wichmann HE, Lyketsos CG, Morgan K, Marson DC, Brown K, Martiniuk F, Medway C, Mash DC, Nöthen MM, Masliah E, Hooper NM, McCormick WC, Daniele A, McCurry SM, Bayer A, McDavid AN, Gallacher J, McKee AC, van den Bussche H, Mesulam M, Brayne C, Miller BL, Riedel-Heller S, Miller CA, Miller JW, Al-Chalabi A, Morris JC, Shaw CE, Myers AJ, Wiltfang J, O'Bryant S, Olichney JM, Alvarez V, Parisi JE, Singleton AB, Paulson HL, Collinge J, Perry WR, Mead S, Peskind E, Cribbs DH, Rossor M, Pierce A, Ryan NS, Poon WW, Nacmias B, Potter H, Sorbi S, Quinn JF, Sacchinelli E, Raj A, Spalletta G, Raskind M, Caltagirone C, Bossù P, Orfei MD, Reisberg B, Clarke R, Reitz C, Smith AD, Ringman JM, Warden D, Roberson ED, Wilcock G, Rogaeva E, Bruni AC, Rosen HJ, Gallo M, Rosenberg RN, Ben-Shlomo Y, Sager MA, Mecocci P, Saykin AJ, Pastor P, Cuccaro ML, Vance JM, Schneider JA, Schneider LS, Slifer S, Seeley WW, Smith AG, Sonnen JA, Spina S, Stern RA, Swerdlow RH, Tang M, Tanzi RE, Trojanowski JQ, Troncoso JC, Van Deerlin VM, Van Eldik LJ, Vinters HV, Vonsattel JP, Weintraub S, Welsh-Bohmer KA, Wilhelmsen KC, Williamson J, Wingo TS, Woltjer RL, Wright CB, Yu CE, Yu L, Saba Y, Pilotto A, Bullido MJ, Peters O, Crane PK, Bennett D, Bosco P, Coto E, Boccardi V, De Jager PL, Lleo A, Warner N, Lopez OL, Ingelsson M, Deloukas P, Cruchaga C, Graff C, Gwilliam R, Fornage M, Goate AM, Sanchez-Juan P, Kehoe PG, Amin N, Ertekin-Taner N, Berr C, Debette S, Love S, Launer LJ, Younkin SG, Dartigues JF, Corcoran C, Ikram MA, Dickson DW, Nicolas G, Campion D, Tschanz J, Schmidt H, Hakonarson H, Clarimon J, Munger R, Schmidt R, Farrer LA, Van Broeckhoven C, C O'Donovan M, DeStefano AL, Jones L, Haines JL, Deleuze JF, Owen MJ, Gudnason V, Mayeux R, Escott-Price V, Psaty BM, Ramirez A, Wang LS, Ruiz A, van Duijn CM, Holmans PA, Seshadri S, Williams J, Amouyel P, Schellenberg GD, Lambert JC, Pericak-Vance MA, Alzheimer Disease Genetics Consortium (ADGC),, European Alzheimer’s Disease Initiative (EADI),, Cohorts for Heart and Aging Research in Genomic Epidemiology Consortium (CHARGE),, Genetic and Environmental Risk in AD/Defining Genetic, Polygenic and Environmental Risk for Alzheimer’s Disease Consortium (GERAD/PERADES),. Genetic meta-analysis of diagnosed Alzheimer's disease identifies new risk loci and implicates Aβ, tau, immunity and lipid processing. Nat Genet. 2019 Mar;51(3):414-430. Epub 2019 Feb 28 PubMed.
Bellou E, Baker E, Leonenko G, Bracher-Smith M, Daunt P, Menzies G, Williams J, Escott-Price V, Alzheimer's Disease Neuroimaging Initiative. Age-dependent effect of APOE and polygenic component on Alzheimer's disease. Neurobiol Aging. 2020 Sep;93:69-77. Epub 2020 Apr 30 PubMed.
Koopmans F, van Nierop P, Andres-Alonso M, Byrnes A, Cijsouw T, Coba MP, Cornelisse LN, Farrell RJ, Goldschmidt HL, Howrigan DP, Hussain NK, Imig C, de Jong AP, Jung H, Kohansalnodehi M, Kramarz B, Lipstein N, Lovering RC, MacGillavry H, Mariano V, Mi H, Ninov M, Osumi-Sutherland D, Pielot R, Smalla KH, Tang H, Tashman K, Toonen RF, Verpelli C, Reig-Viader R, Watanabe K, van Weering J, Achsel T, Ashrafi G, Asi N, Brown TC, De Camilli P, Feuermann M, Foulger RE, Gaudet P, Joglekar A, Kanellopoulos A, Malenka R, Nicoll RA, Pulido C, de Juan-Sanz J, Sheng M, Südhof TC, Tilgner HU, Bagni C, Bayés À, Biederer T, Brose N, Chua JJ, Dieterich DC, Gundelfinger ED, Hoogenraad C, Huganir RL, Jahn R, Kaeser PS, Kim E, Kreutz MR, McPherson PS, Neale BM, O'Connor V, Posthuma D, Ryan TA, Sala C, Feng G, Hyman SE, Thomas PD, Smit AB, Verhage M. SynGO: An Evidence-Based, Expert-Curated Knowledge Base for the Synapse. Neuron. 2019 Jul 17;103(2):217-234.e4. Epub 2019 Jun 3 PubMed.
Make a Comment
To make a comment you must login or register.