ADNI Results: A Story of Standardization and Science
Quick Links
The results of ADNI are arriving at two different levels. One is the aspect of coordinating and standardizing multisite procedures (the “how”); the other is actual new scientific data (the “what”). On the “how,” the verdict from numerous scientists interviewed for this series was that ADNI has set the standard for future multisite brain imaging studies. Cliff Jack at the Mayo Clinic in Rochester, Minnesota, directed standardization of the MRI imaging. This project required rewriting scanning pulse sequences for three major MRI vendors and persuading the vendors to have these sequences installed, as well as use and testing of a geometric phantom for calibration. His group also provides quality control for every uploaded ADNI MRI scan. “The MRI analyses are state of the art, providing regional maps of involvement that may be useful for patient selection or measuring progression,” comments Michael Grundman of Elan Pharmaceuticals in South San Francisco.
Likewise, Robert Koeppe at the University of Michigan in Ann Arbor, and Bill Jagust at the University of California, Berkeley, normalized and performed quality control on the FDG-PET data collected on a variety of different PET scanners at more than 50 sites. This work, in turn, laid the groundwork for the subsequent PIB-PET ADNI substudy (see Part 5 of this series) to do the same. For their part, Leslie Shaw and John Trojanowski at the University of Pennsylvania Medical School in Philadelphia lead a qualification study on CSF biomarkers in which seven expert labs—some academic, some industrial—in four different countries showed that ADNI’s multiplex assay for Aβ and tau measurements were reproducible day in and day out within less than 10 percent variability. This strengthened the validity of the fluid measurements across ADNI.
“ADNI has succeeded beyond expectations in terms of delivering initial data in time for some critical studies, as well as advancing the standards for multisite MRI, FDG-PET, and 11C PIB studies, not to mention clinical trial quality assays for important analytes in cerebrospinal fluid,” noted Bill Potter, who represents Merck on ADNI’s Industry Scientific Advisory Board. “Simply working out what it takes to obtain quality data across sites for all of these modalities has been worth the investment for any company planning to do studies of compounds that might modify the course of AD.” Sources interviewed for this article generally confirmed that both the ADCS and pharmaceutical companies are using ADNI’s methodologies in ongoing clinical trials.
On the “what,” i.e., the research data, it is early days. The comprehensive comparison of methods is not possible for another year. With the first year of follow-up complete, ADNI scientists are currently analyzing the fluid specimens and summarizing the raw imaging data computationally. Laurel Beckett at University of California, Davis, heads ADNI’s statistics core. “We are really trying to set up for the big push to summarize our first year of very complex multifactorial tracking of change.” At the International Conference on Alzheimer’s Disease (ICAD), held last July in Chicago, the loudest buzz surrounded the three issues of confirming previous work, power calculations for trials, and intriguing signals in the normal controls of ADNI. Here are highlights of the preliminary analysis of the available data so far.
ADNI has completed enrollment of 819 people, 229 normal, 398 MCI, 192 AD. In the two years since their first assessment, 26 percent of those with MCI progressed to a diagnosis of AD, while less than 5 percent of the normal controls developed MCI. An even smaller fraction reverted back to MCI from AD and to normal status from MCI. These conversions will be critical to validate how clinically relevant the imaging and biomarker changes are that ADNI is beginning to show. ADNI scientists showed the results of the complete one-year follow-up of the participant’s clinical and neuropsychological and MRI data in the form of spaghetti plots. These are colorful overlaid line graphs showing how each person fared over time on a given measure. They show at a glance that the data confirm overall expectations. That is, clinical measures show expected trends in normal control, MCI, and AD, but do so with a lot of zigzagging, whereas imaging data show the expected trends with much less fluctuation. The MCI group is the most heterogeneous at this point.
A handful of different laboratories within the MRI core (and many more outside of it) are each conducting their own analyses of the same magnetic resonance scans. For example, Nick Fox’s group at University College, London, measures boundary shift integrals, Norbert Schuff’s at University of California, San Francisco, focuses on hippocampal volume, Colin Studholmen’s at UCSF and Paul Thompson’s at UCLA use tensor-based analysis, Gene Alexander’s at the University of Arizona tests vowel-based morphometry, and Anders Dale’s at UCSD uses an automated surface reconstruction software called Freesurfer. All these are different approaches to quantify how the brain’s tissue shrinks and its ventricles expand over time. The goal is to find robust measures of change that reflect more than merely a person’s advancing age but indeed correlate tightly with how a person’s clinical state worsens over time. It is too early to draw a definitive comparison because much of the longitudinal data is yet to come. That said, early ADNI data confirm previous findings from smaller studies that certain brain areas, especially in the hippocampus, atrophy early in AD and offer a robust marker for change. Moreover, it appears as if hippocampal volume loss accelerates as the disease progresses clinically, Michael Weiner of UCSF noted at ICAD (see also Nestor et al., 2008). It will be interesting to see if this correlates also with a biomarker change.
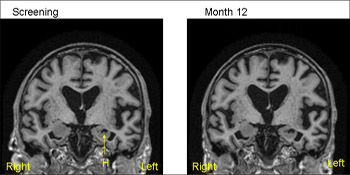
1.5T MRI scans from the same patient (MCI) from ADNI—baseline (screening) on the left and 12 months on the right. The 12-month scan has been registered to the baseline so that both scans are positional matched (the same position and orientation) so that comparisons are facilitated. Note that even with simple visual inspection one can see loss of volume of the hippocampus (H) with increase in the CSF filled space (temporal horn) around the hippocampus. View larger image. Image credit: Nick Fox
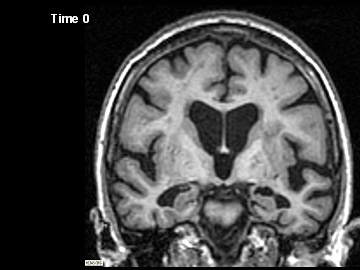
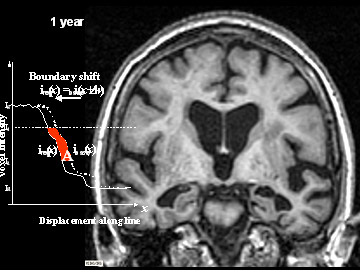
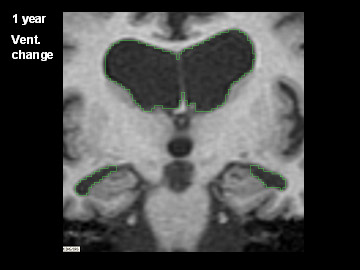
ADNI Participant With AD Imaged at Study Entry and One Year Later
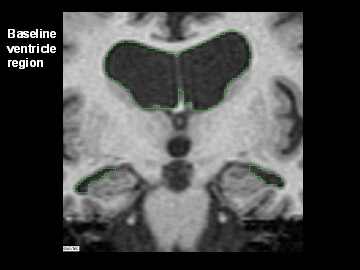
Flicking back and forth between image 1 and 2 illustrates how the boundaries of the gray matter in the person's brain have shifted (i.e., shrunk). The red area quantifies the volume loss during this year. Images 3 and 4 illustrate the corresponding expansion of the fluid-filled ventricles in the same person during this time. Image credit: Nick Fox, University College London
Findings like this are where the ADNI biostatisticians come in to make sure that ways of understanding how imaging data relate to clinical change are robust in the face of how the real data behave, Beckett explained. “For example, if we had assumed that hippocampal volume shrinks at a steady pace in AD, but found that in fact the rate accelerated over the course of our follow-up, we’d have to rethink how to relate that to, say, change in the ADAS-Cog or other measures of cognitive function.”
Likewise, functional imaging data using FDG-PET (which indicates glucose use in brain areas) are undergoing different types of analyses to see which provide the best markers. Jagust, Norman Foster at the University of Utah, Salt Lake City, and Eric Reiman at the University of Arizona, Phoenix, are leading these groups. One odd finding by Foster’s group stood out right away, Weiner noted at ICAD, namely that one in 10 AD cases appeared to have a more FTD-like than AD-like pattern of brain metabolism, suggesting that some fraction of ADNI's AD patients may at autopsy prove to have been misdiagnosed. Headed by Nigel Cairns, ADNI's neuropathology core at Washington University in St. Louis, Missouri, provides the gold standard diagnosis for ADNI participants who die after entering the study. Indeed, Cairns and his colleagues Lisa Taylor-Reinwald have already determined that, of the three brains that have come to autopsy from ADNI participants, the first had major Lewy body pathology besides classic AD pathology even though the person had been clinically diagnosed with AD, not DLB. Hence the definitive diagnosis partly disagreed with the clinical assessment. This reinforces the notion that an inherent error rate in the clinical diagnosis in effect puts a “glass ceiling” on the success rate of predictive tests, which are typically measured against the clinical diagnosis.
That aside, the overall preliminary finding of the FDG-PET analyses are that reduced metabolism in the parietal/temporal lobe marks progression. Emerging data from Reiman’s and Jagust’s groups indicate that unbiased analyses tend to beat assumptions made on previously specified anatomical regions of interest in finding the earliest and strongest FDG-PET changes. These analyses point to the posterior cingulate and the precuneus as brain areas that are the first to be on the wane. Overall, the most precise MRI measures appear to trump FDG-PET measures at this point, and scanning people in the higher field strength 3.0 T magnets did not appear to improve data significantly over those gleaned in the standard 1.5 T scanners. Check Part 3 of this series for more ADNI results.—Gabrielle Strobel.
This is Part 2 of a six-part series. See also Parts 1, 3, 4, 5, 6. Read the entire series [.pdf].
References
News Citations
- Bumps Along the Way—ADNI’s Snafus
- More ADNI Results 2: It’s All About Power
- Add to ADNI: Imaging Amyloid and Analyzing the Genome
- Worldwide ADNIs: Other Nations Follow Suit
Paper Citations
- Nestor SM, Rupsingh R, Borrie M, Smith M, Accomazzi V, Wells JL, Fogarty J, Bartha R, . Ventricular enlargement as a possible measure of Alzheimer's disease progression validated using the Alzheimer's disease neuroimaging initiative database. Brain. 2008 Sep;131(Pt 9):2443-54. PubMed.
Other Citations
External Citations
Further Reading
Annotate
To make an annotation you must Login or Register.
Comments
No Available Comments
Make a Comment
To make a comment you must login or register.