CSF and Brain Markers Highlight Different Facets of Dementia
Quick Links
Part 1 of a two-part story. Click here for Part 2.
While biomarkers have opened a window onto Alzheimer’s pathogenesis, the view has remained cloudy. At the Alzheimer’s Association International Conference 2017 held July 16-20 in London, the number of biomarker talks was noteworthy, with nearly one-quarter of all sessions devoted to this topic. So inescapable was the subject that John Hardy of University College London quipped, “This is the biomarkers meeting.” Researchers discussed new data that clarify how various biomarkers relate to each other, and what they say about the underlying disease. Speakers solidified a recent trend showing that cerebrospinal fluid proteins and PET scans, while correlated, provide different types of information, with the former best suited for diagnosis, and the latter better for tracking progression. Several presentations reinforced the idea that tau pathology, rather than amyloid plaques or atrophy, drives cognitive decline, while others discussed how the presence of some of these pathologies can be used to predict others (see Part 2 of this story). Overall, researchers are painting an increasingly panoramic picture of what biomarker data means. Keep an eye on Alzforum for upcoming stories on longitudinal biomarkers and neuroimaging correlates of cognitive reserve.
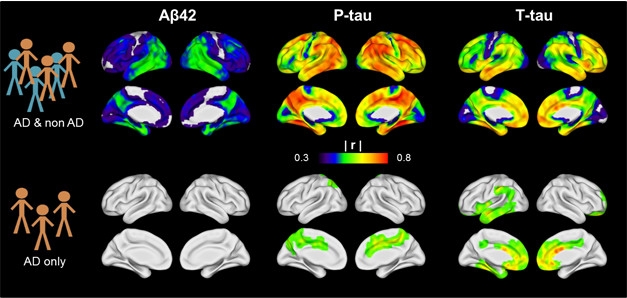
CSF vs PET. CSF Aβ42, phospho-tau, and total tau correlate with tau PET signals in a mixed AD and non-AD population (top row), but not within the AD group alone (bottom row). [Image courtesy of Renaud La Joie.]
Markers Tell Different Stories
Many clinical studies use either CSF or PET measures of amyloid as inclusion criteria, on the assumption that they are equivalent. In London, researchers asked if they truly are. The answer was a clear no. Susan Landau of the University of California, Berkeley, noted that PET signals from amyloid and tau tracers measure the accumulation of fibrils in the brain, whereas CSF markers of Aβ and tau reflect the balance between production and clearance of soluble forms. Nonetheless, both modalities can indicate disease, and abnormal CSF and PET values typically correlate with each other across populations.
In a recent study from Landau’s group, diagnoses based on predetermined CSF Aβ and amyloid PET cutoff values agreed in 82 percent of participants. Landau noted that other studies have found even higher concordance, in the range of 85–90 percent. In her study, CSF values were determined using new automated assays that are more precise than previous ELISA-based methods (Aug 2015 conference news; Apr 2017 conference news). Still, some of the discordance may be due to remaining technical issues with assays, Landau told Alzforum. There may also be floor effects that occur with CSF Aβ42 because these values drop so low that they are difficult to measure. However, much of the discordance likely reflects real differences between how CSF and PET measures behave, she said.
Notably, among patients who tested positive on both measures, the researchers found no correlation between absolute CSF Aβ levels and PET binding values. Partly, this occurs because PET and CSF markers follow distinct trajectories throughout the course of disease, Landau said (Toledo et al., 2015). CSF Aβ drops early in preclinical AD and then stays low, whereas the amyloid PET signal rises steadily for a longer period of time before falling later, in the symptomatic phase of the disease, forming an inverted U curve. This means the two measures will not change precisely in tandem.
Supporting this, longitudinal changes in CSF Aβ and amyloid PET were correlated at four years of follow-up, but not at two. “That is not encouraging in terms of their potential use as secondary endpoints in a clinical trial,” Landau wrote to Alzforum. Trials often span just one or two years. An underlying problem is that researchers do not yet understand how longitudinal changes in CSF Aβ versus amyloid PET relate to pathology, which can only be directly measured at autopsy, Landau added.
What bearing do these differences between CSF and PET have on diagnosis and prognosis? Clifford Jack of the Mayo Clinic in Rochester, Minnesota, summed up the issue as a matter of state versus stage. CSF analytes reflect a pathophysiological state, he said, whereas imaging stages the disease. Thus, either measure can work for diagnosis, but PET scans will perform better in measuring progression and trial outcomes, Jack said.
Other talks supported this conclusion and extended the concept to tau imaging. Renaud La Joie of the University of California, San Francisco, compared 24 amyloid-positive AD patients to 29 amyloid-negative people diagnosed with other neurodegenerative diseases, such as frontotemporal dementia or progressive supranuclear palsy. Across the whole cohort, the tau PET signal correlated positively with CSF tau and negatively with CSF Aβ. This shows either biomarker modality works for diagnosis, La Joie said. Intriguingly, he saw the strongest correlation between CSF phospho-tau and tau PET, particularly in the cingulate, precuneus, and lateral parietal regions (see image above). Previous work suggests that CSF p-tau reflects a process specific to AD, whereas total tau indicates general neurodegeneration. If so, that might explain why p-tau and tau PET correspond closely. The findings also support the proposed A/T/N classification scheme, where CSF p-tau and tau PET are grouped together as markers of tau pathology, while CSF t-tau is considered a neurodegeneration marker (Aug 2016 conference news; Chhatwal et al., 2016).
Despite the overall correlation between tau PET and CSF markers in the whole UCSF cohort, the tau PET signal correlated poorly with CSF Aβ or even CSF tau within the AD group. In other words, although everyone in the AD group had low CSF Aβ, there was no relationship between how low Aβ was and how high tau PET was. Likewise, there was almost no relationship between how high CSF tau was and how high tau PET was in AD patients (see image). The finding emphasizes that CSF and PET measures are not interchangeable for scoring severity of AD, La Joie said.
Notably, the strength of the tau PET signal correlated with symptom severity better than CSF tau did. Many studies have tied tau tangles to brain atrophy and cognitive decline (May 2016 news; Aug 2016 conference news; Mar 2017 news). In years past, researchers believed that CSF tau would continue to rise in AD and would therefore constitute a progression marker, but La Joie’s new research strengthens a more recent realization that CSF tau does not actually track progression through the symptomatic stage of disease. Researchers are hoping that tau PET will provide a more useful progression marker.
“In the next few years, it will be crucial to analyze longitudinal multimodal imaging data to help us disentangle the respective dynamics of each modality,” La Joie wrote to Alzforum.—Madolyn Bowman Rogers
References
News Citations
- All Signs Point to Tau Tangles as the Culprit in Fading Memory
- CSF Aβ Assays Remain Fickle: Robots to the Rescue?
- Are CSF Assays Finally Ready for Prime Time?
- Staging of Alzheimer’s, the Second: Neurodegeneration Does Not Equal Tauopathy
- On Multiple Marker Analysis, Tangles Track Best With Functional Decline
- Tau PET Studies Agree—Tangles Follow Amyloid, Precede Atrophy
- Multimodal Imaging Ties Tau to Neurodegeneration, and Symptoms
Paper Citations
- Toledo JB, Bjerke M, Da X, Landau SM, Foster NL, Jagust W, Jack C Jr, Weiner M, Davatzikos C, Shaw LM, Trojanowski JQ, Alzheimer’s Disease Neuroimaging Initiative Investigators. Nonlinear Association Between Cerebrospinal Fluid and Florbetapir F-18 β-Amyloid Measures Across the Spectrum of Alzheimer Disease. JAMA Neurol. 2015 May;72(5):571-81. PubMed.
- Chhatwal JP, Schultz AP, Marshall GA, Boot B, Gomez-Isla T, Dumurgier J, LaPoint M, Scherzer C, Roe AD, Hyman BT, Sperling RA, Johnson KA. Temporal T807 binding correlates with CSF tau and phospho-tau in normal elderly. Neurology. 2016 Aug 30;87(9):920-6. Epub 2016 Jul 29 PubMed.
Further Reading
Annotate
To make an annotation you must Login or Register.
Comments
No Available Comments
Make a Comment
To make a comment you must login or register.